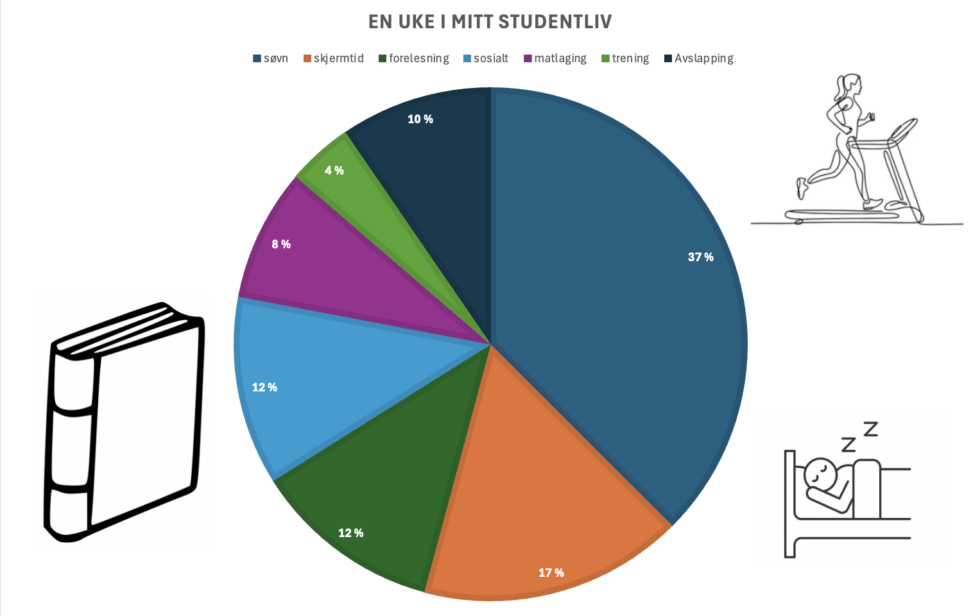

The visualization represents how I spend my time during a typical week as a student. The data is measured in hours per week and includes sleep, lectures, screen time, exercise, social activities and cooking. The data was collected my me and what I spend time on during a random week in my life.
The visualization was created digitally in Microsoft Excel. Some small illustrations used in the visualization were found online and are used only as visual elements. The copyright of these illustrations belongs to their respective creators/owners.