
1048 Data visualizations Categorized "my city in data" (page 46 of 53)
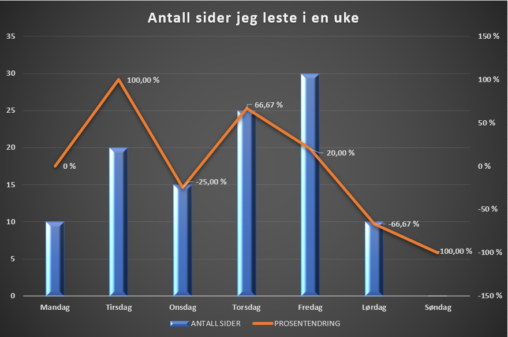
Oversikten viser hvor mange sider jeg leste fra en bok i en uke. Stolper visualiserer antall sider og linje viser prosentendringen. Dataene hentet fra registreringen som jeg gjorde…
This bar-chart shows how much homework I have done today.
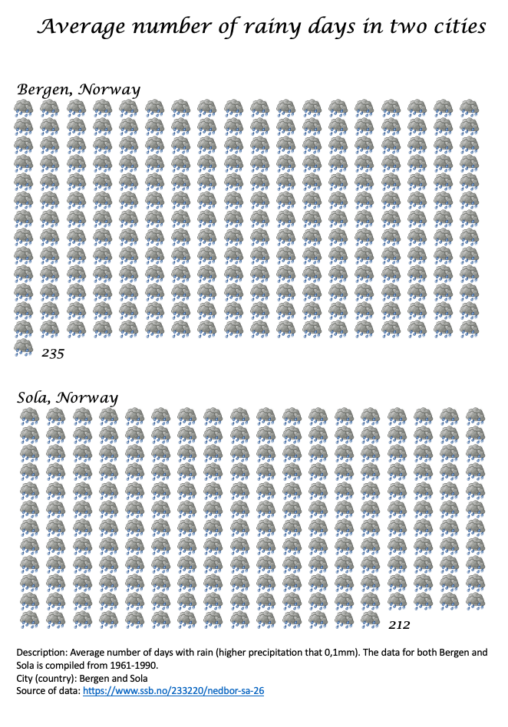
Average number of days with rain (higher precipitation that 0,1mm). The data for both Bergen and Sola is compiled from 1961-1990. Data collected from “https://www.ssb.no/233220/nedbor-sa-26”
This bar-chart shows how much homework I have done today.

År Andel 2005 66,1 2006 66,7 2007 67 2008 66,2 2009 65,8 2010 65,3 2011 65,2 2012 64 2013 63,6 2014 62,9 2015 61,5 2016 60 2017 57,9…

The graph shows the share of fires for each month in Bergen compared to Norway. 100 % i defined as the total number of fires for each location….
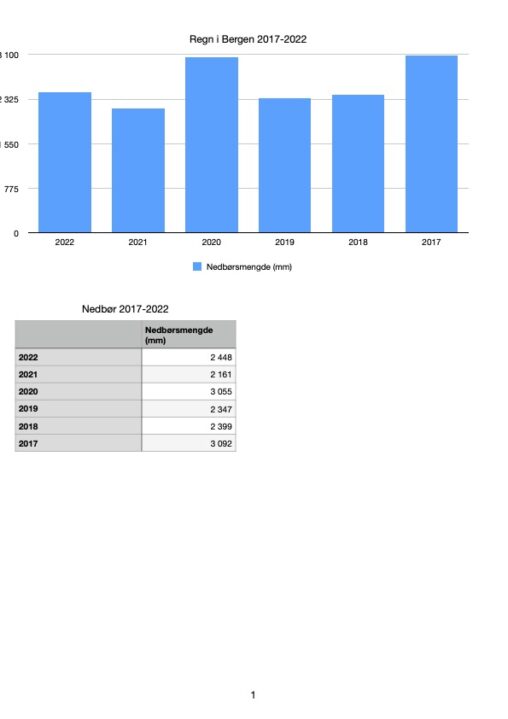
Millimeter rain per year in Bergen, Norway period 2017-2022. Data from Bergen Kommune and Weatherstats
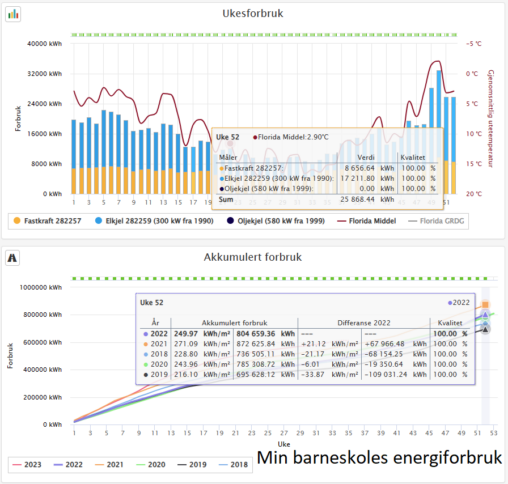
This is a detailed consumption data of my childhood school.
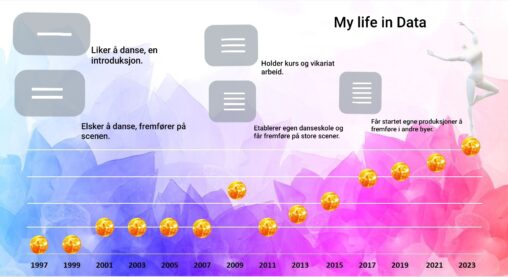
This is a data visualization of what role dance played in my life from year 1997 to start of 2023. The data shows how the role changed throughout…
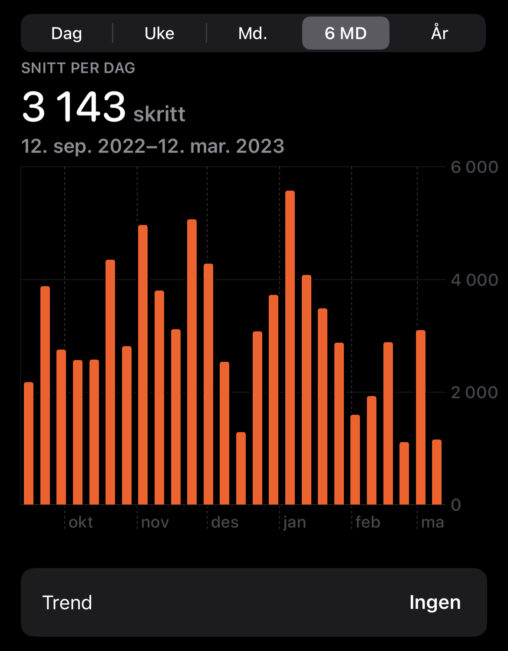
The diagram shows the average number of steps I have taken over the past 6 months. We see in January that more steps were taken than usual. It’s…
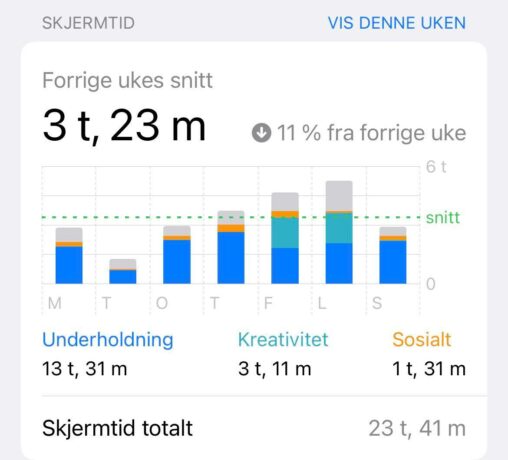
The data shows total time spent on my phone last week (week 10), collected using iphone’s software. The data shows 13 hours and 31 minutes spent on “entertainment”,…

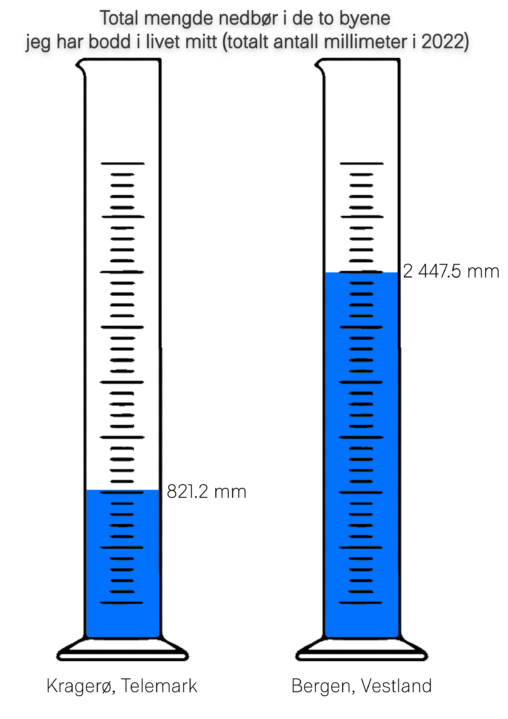
Comparison for the total rainfall in 2022, between the two cities Kragerø and Bergen, the two cities I’ve lived in my life
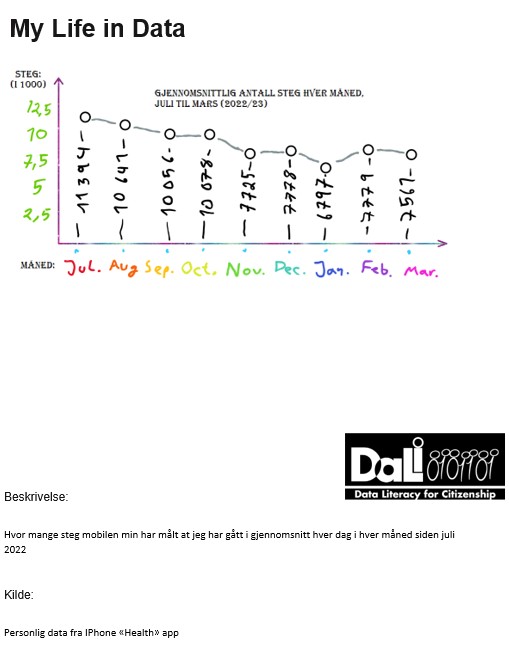
Min gjennomsnittlige daglige antall steg hver måned fra juli 2022 til mars 2023. Vertikal linje representerer antall steg (i 1000) og horisontal linje representerer hvilken måned fra juli…
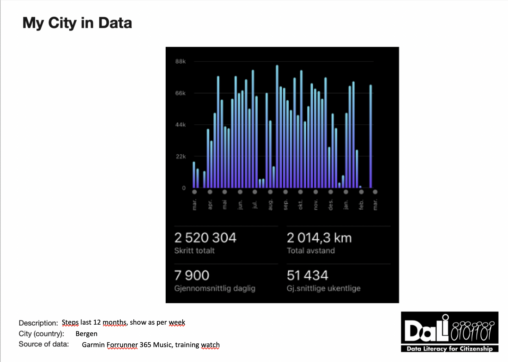
The data is representing steps counted by my training watch. You can see the total of steps for the last year, total km for the last year, average…

The information is borrowed from yr.no showing the average amount of rainfall in Bergen the last year. Each pole represents a mont and amount of rainfall, and the…
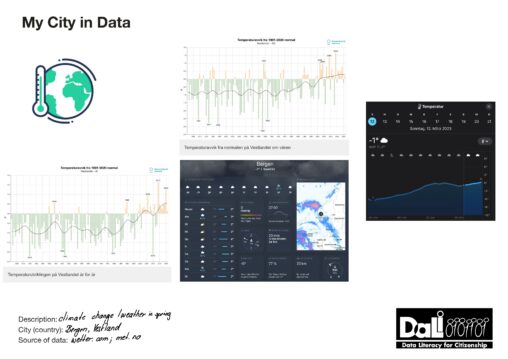
The Graphics show the climate change in Norway from 1900 – today for the whole year and also one in spring. As a contrast I added the graphics…