
1051 Data visualizations Categorized "my city in data" (page 47 of 53)
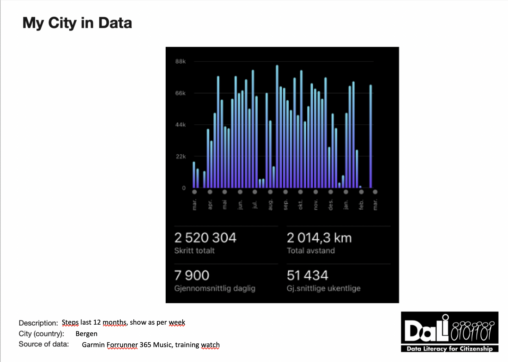
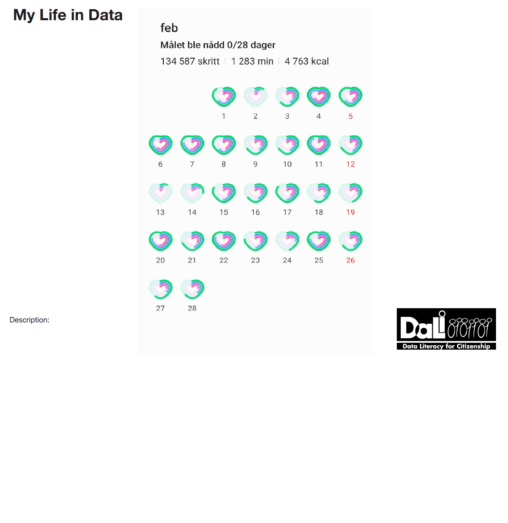
The data is representing steps counted by my training watch. You can see the total of steps for the last year, total km for the last year, average…

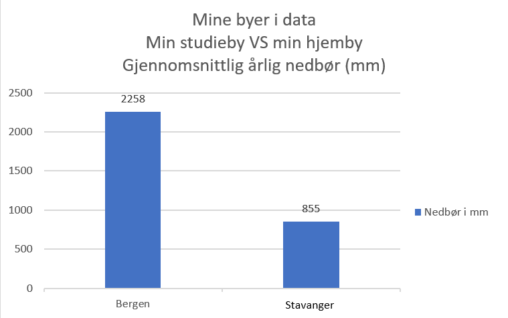
The information is borrowed from yr.no showing the average amount of rainfall in Bergen the last year. Each pole represents a mont and amount of rainfall, and the…
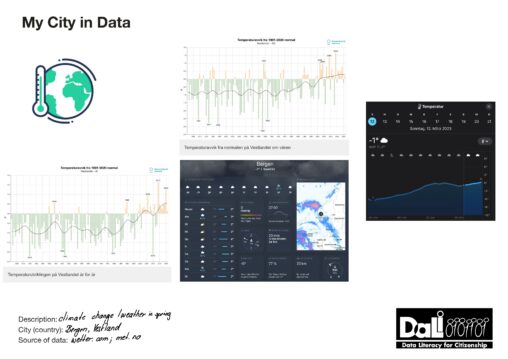
The Graphics show the climate change in Norway from 1900 – today for the whole year and also one in spring. As a contrast I added the graphics…
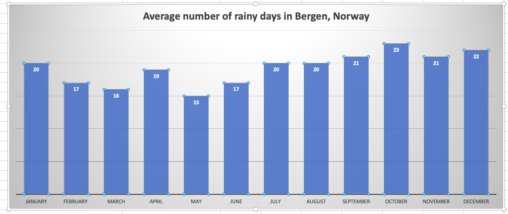
Average number of rainy days in Bergen (per month). January – December.
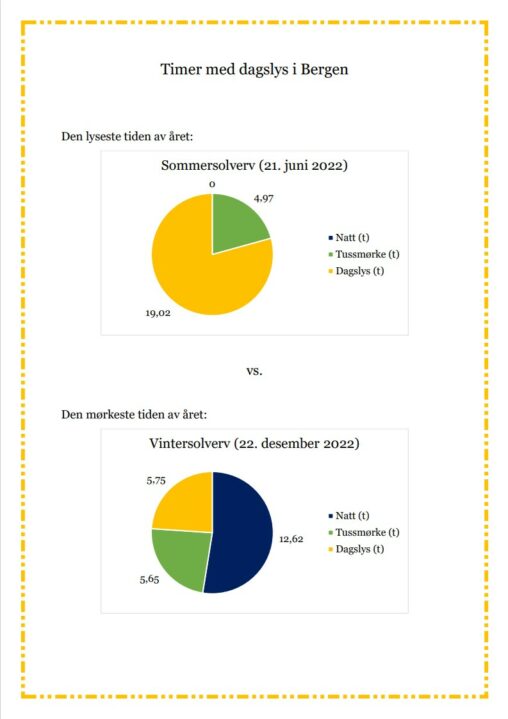
This data visualizes the difference between daylight in winter and daylight in summer in Bergen, Norway. The data is taken from timeanddate.no.
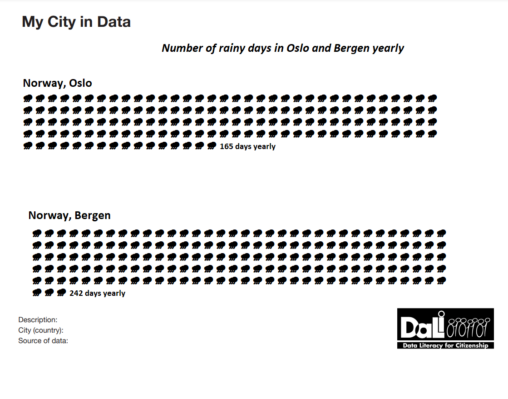
This is a data visualization of how many days it rains yearly in Oslo and Bergen, both cities I have lived in.

This is taken from my journal, where I´ve collected data about my daily habits – if I´ve been able to do them or not, if I´ve slept well…
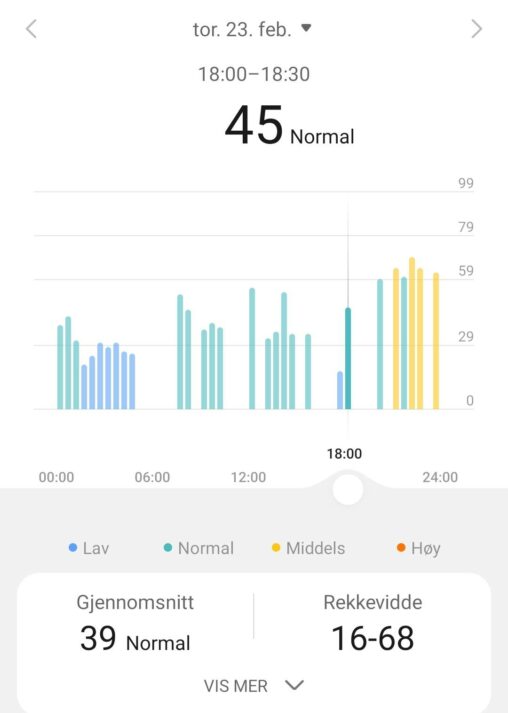
This is my stress level during the day. From 21 -23 Manchester United played against Barcelona.

The work is based on Yr.no’s weather history in Bergen and Kristiansand. This was recorded from the 8th of February until the 9th of march and in this…
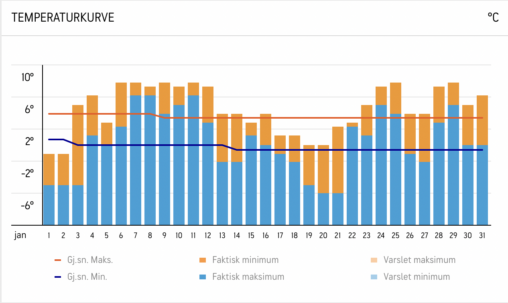
Grafen viser en oversikt over hvordan temperaturen i Bergen har variert i januar måned. © 2023 AccuWeather, Inc. “AccuWeather” og sun design er registrerte varemerker som tilhører AccuWeather,…
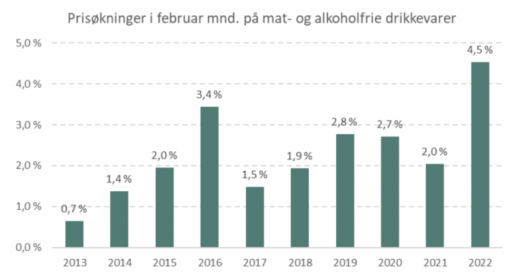
Figuren representerer prisøkning for matprisene på mat- og alkoholfrie drikkevarer, fra 2013-2022.

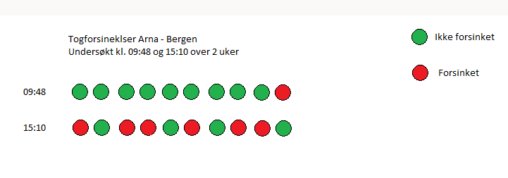
Data represents how often the train is late over 10 separate days. I would like to it over a longer period, but I noted only the most common…
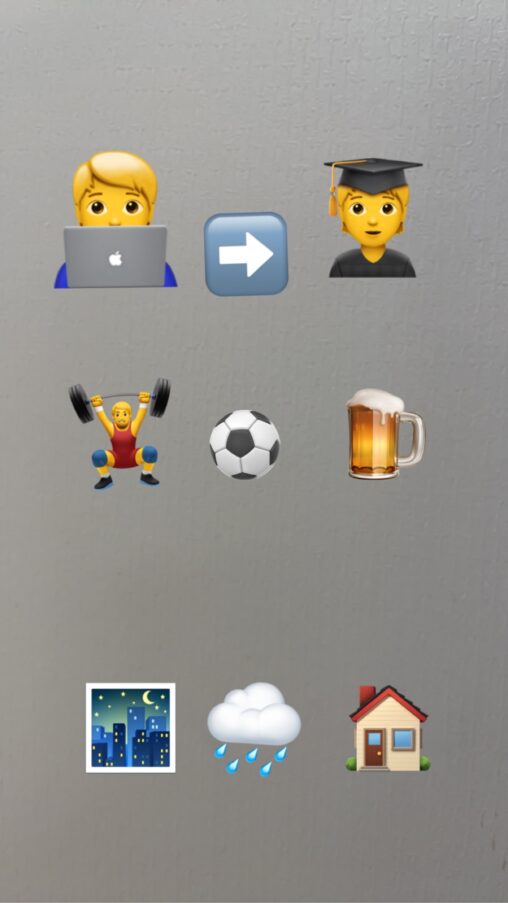
my lifestyle showing that i study, love to train and drink beer, as well living in bergen where it rains a lot

This is a visualization of my travel journey in 2022 and shows how many days i have been away from home (Norway).
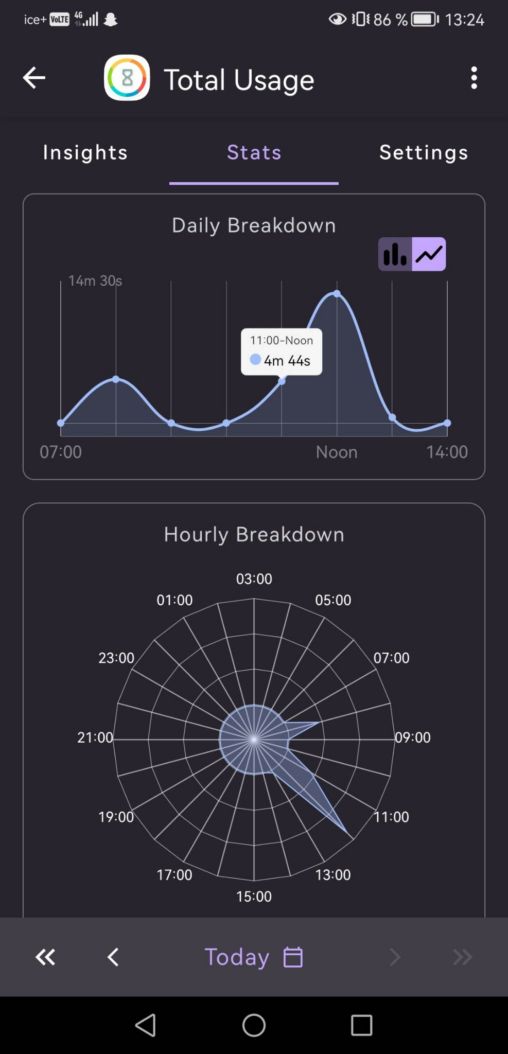
This is a screenshot from time and usage mapping software application installed on my mobile phone. The diagrams descripe and show how much time, and when, time usage…
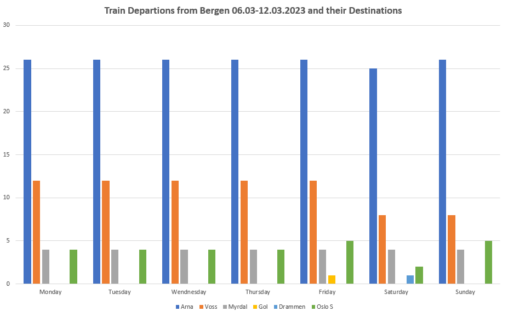
This data visualization is showing the number of train departures for each day and their destination. It only represent the week 06.03 to 12.03.2023. We can see that…
Hva jeg brukte tiden min på februar 2023. Eviny – jobb iaeste – verv Sideprosjekter- alt av ekstra ting jeg synes det er nyttig å bruke tid på,…