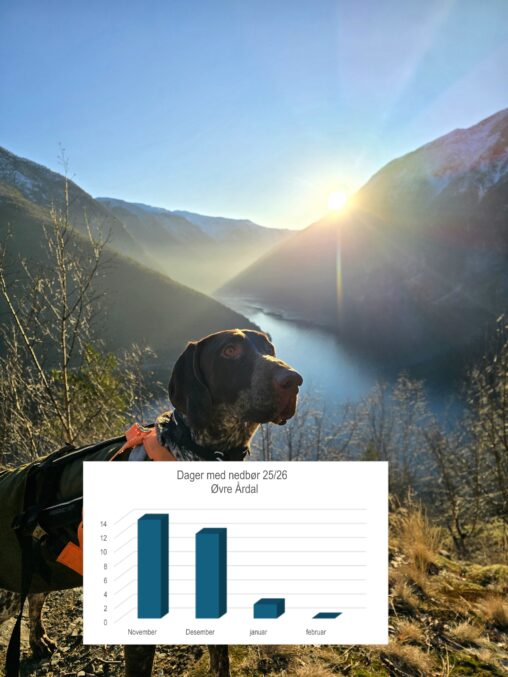
3 Data visualizations Tagged "#Winter"

photo of the beautiful weather in Norway this winter, diagram shows days with rain/snow

Vintervær på Vestlandet, Winter in Norway

Dog, mountains, Norway, sun

The picture shows a visualization of amount of snow shown by an illustration of snow piled up. It has dates showing the development of the amount of snow

Snømengde på platten utenfor huset i Tromsø, januar og februar 2026

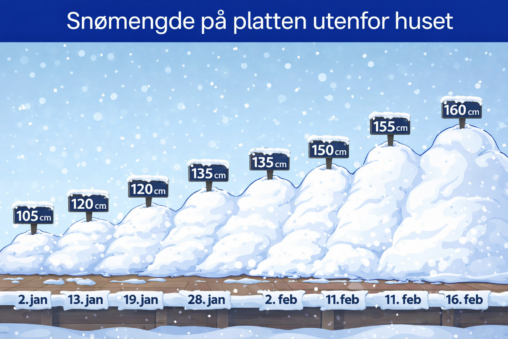
The representation is my own measurements of how much snow is on the terrace outside my house in Tromsoe, Northern Norway, in January and February. The owner of…

The power consumption of a medium sized apartment in Bergen, Norway for 2022 vs. 2021

A comparison of my apartments energy-consumption in kWh, 2022 vs. 2021

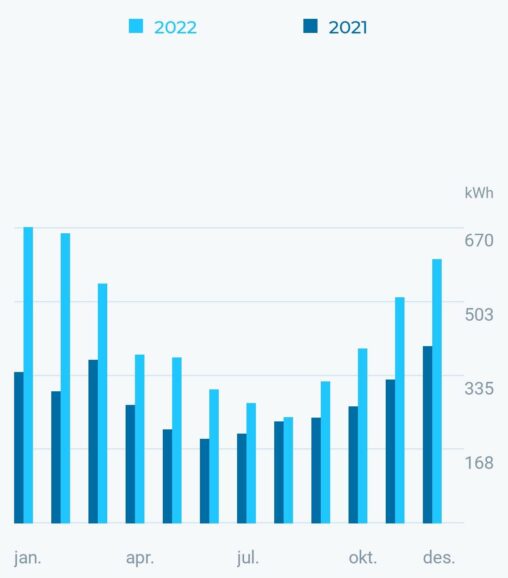
The bar chart shows my energy consumption, comparing 2022 to 2021. Along the x-axis are the months and the y-axis shows the amount of kWh used (1kWh =…