
9 Data visualizations Tagged "#week"
[link url=”https://www.canva.com/design/DAHCEmBUm2Y/q9tI3vXxlZ6gn_qEqbtudw/edit?utm_content=DAHCEmBUm2Y&utm_campaign=designshare&utm_medium=link2&utm_source=sharebutton” text=”Weekly report of time”
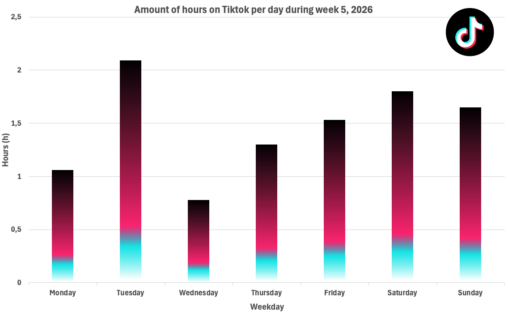
Graph shows the amount of hours (h) used on Tiktok per day (Monday – Sunday) during week 5 in 2026. Creative Commons licence. Data collected from screen time…
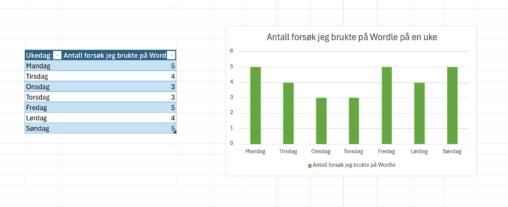
Et kolonne diagram, der hver kolonne er en ukedag. Der måles hvor mange forsøk jeg brukte på Wordle i løpet av en uke. Wordle er et ord-gjette spill…

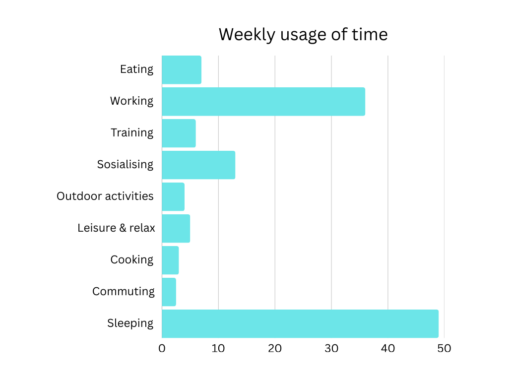
Dette er hvor mange timer jeg har brukt på telefonen sist uke (uke 36). Visualiseringen er laget i excel.

A stacked bar chart showcasing how many grams of protein, carbs and fat I ate in one specific week of my life. This week is nothing out of…

Week 35 og uke 36 2024 august and september. My data and numbers of my study time pr Day


A bar chart over how many hours/minutes a day I spend on my job and on my phone in a particular week. Time on the phone include private…

Number of trips taken to the store per day over the course of a week (W33, 2022).