
11 Data visualizations Tagged "#UMU"
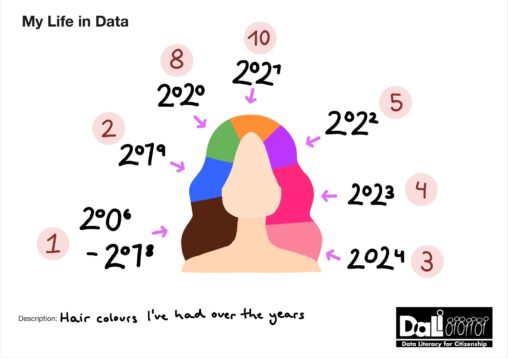
This image reprensents the number of different hair colours throughout my life. Each colour presented in the drawing reprensents the colour that i had for the longest time…
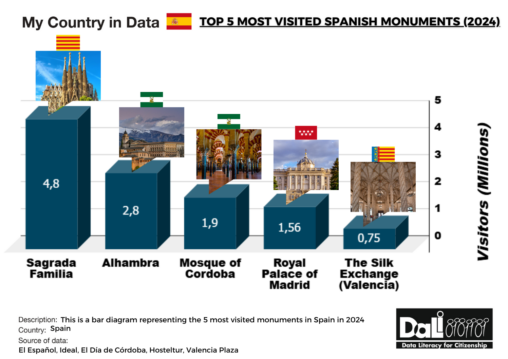
This is a bar diagram representing the 5 most visited monuments in Spain in 2024. The horizontal axis represents the monuments, and the vertical axis, the number of…

There is a pie chart that represents my most listened genres since I have spotify (3 or 4 years).

These are some of the best football teams that people fell in love with and are classified according to my criteria. 1. Barsa 2011/12 Manager: Pep Guardiola Stars:…

At the end of each year, the Spotify music application compiles, in a ranking, the list of your most listened to artists during that year. It also includes,…

According to my mobile data, this is the average time that I listen music during a month, actually during January.

In this presentation, I want to share with my classmates and team the different things that I do in my life and the time I spend on those…

This is a graphic that shows the time I spend listening to music during a week and the type of music I listen to. The genres of music…

This drawing shows the amount of time a day I spend in music. 1 star represents 1 hour. I have included lessons/rehearsals, study at home, reading, and listening…

Here you can see a timetable that represents the time that I spend each day of the week in the university, with my friends, doing other activities and…

These sets of data represent different aspects about the time and places out of my city (in Spain or abroad) where I travelled to or lived in. Thre…