
1 Data visualizations Tagged "#trips #travel #emission #co2"
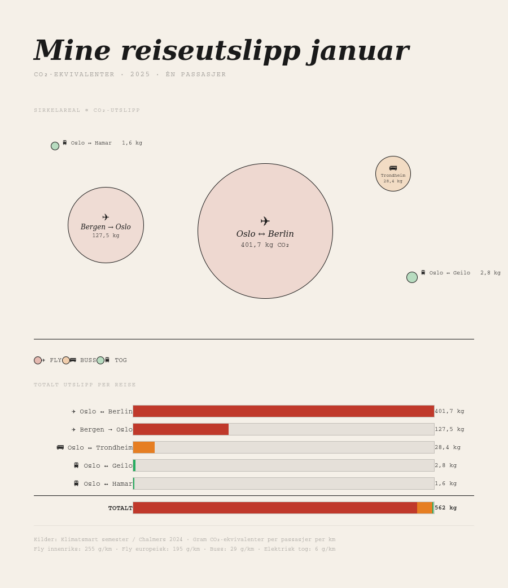
This visualization shows my personal CO₂ emissions from five trips taken in January 2025. Each journey is represented by a proportional circle (where the area corresponds to the…