
2 Data visualizations Tagged "temperature variability"
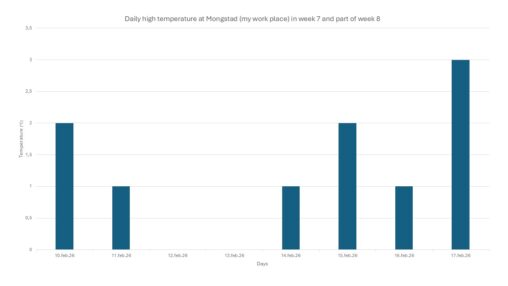
What is visualized is the observed maximum daily temperature (in degree celsius) at Mongstad where I work. The readings were taken from screen displaying temperatures at TCM. The…
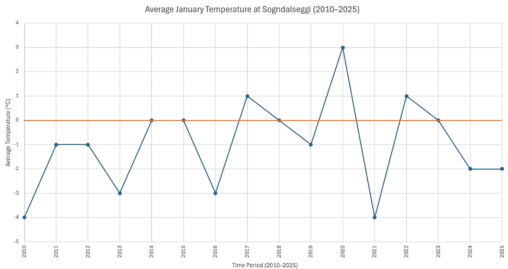
This chart shows the average January temperature at Sogndalseggi from 2010 to 2025, based on data from timeanddate.com. The x-axis represents years (2010–2025), and the y-axis shows temperature…