
3 Data visualizations Tagged "student life"
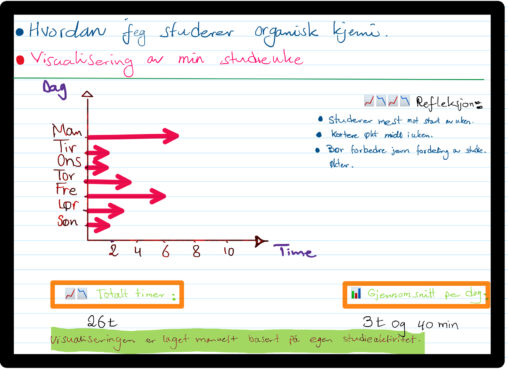
This data visualization shows how many hours I studied organic chemistry during one week. The data represents my personal study activity measured in hours per day from Monday…
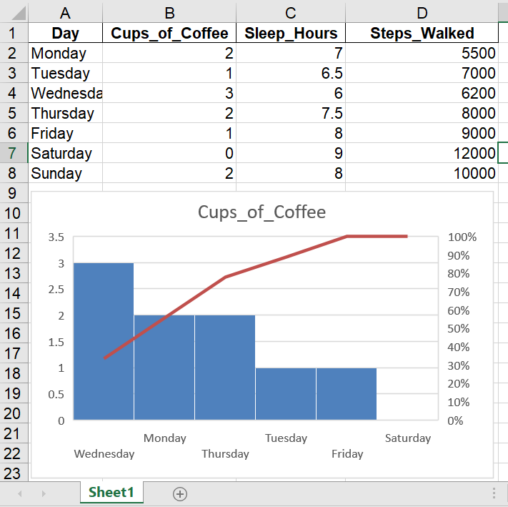
This visualization shows how many cups of coffee I drank each day during one week. The data was self-recorded as part of a personal daily routine tracking exercise….
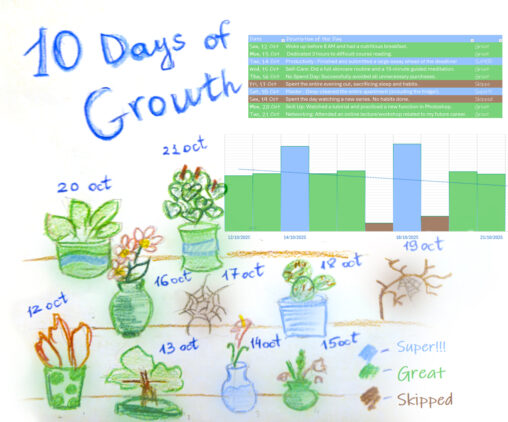
This is my personal habit tracker for 10 days – from October 12 to October 21, 2025. I visualized my progress through the metaphor of growing plants because…