
9 Data visualizations Tagged "#student"
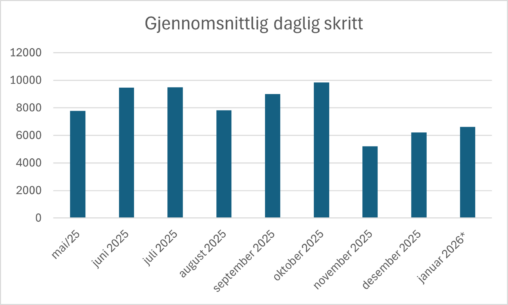
Stolediagram som visualisererer mitt gjennomsnittlige antall daglige skritt (gåing, løping, tur, osv.) per måned fra mai 2025 til januar 2026. Dataene eies av meg og er egeninnsamlet fra…
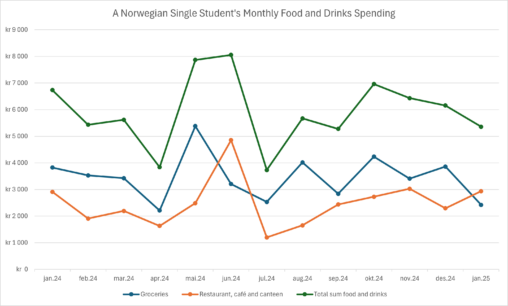
The visualisation is showing the monthly food and drinks spending from January 2024 to January 2025 in Norwegian kroner. Food and drinks are split into two categories: groceries…

I am representing the time I have spent learning, teaching, correcting, calcualting, helping others with and made videoes about mathematics in week 37 in 2023.


The numbers are representing what an average Norwegian full time student spend on studying each week compared to Norwegian law students.

There are three charts, the first one represents the gender distribution of my friends, the second displays the age range my friends are and the last one represents…

text=I have made a diagramme to visualize what a student’s life can contain. As you can see, stress and discipline is a big part of it.

A coarse-grained pie chart depicting a typical day of the week for an anonymous student.