This is one of the playful resources created by the Data Literacy for Citizenship DALI project, co-funded by the Erasmus Plus prorgamme of the European Union.
We invite you to reflect on how your own reality might be represented through data. Find some data relevant to you and visually represent aspects of your life or the world you inhabit.
This project has been funded with support from the European Commission. This website reflects the views only of the authors, and the Commission cannot be held responsible for any use which may be made of the information contained therein.
Unauthorized use and/or duplication of this material without express and written permission from this site’s author and/or owner is strictly prohibited. Excerpts and links may be used, provided that full and clear credit is given to dalicitizens.eu with appropriate and specific direction to the original content.
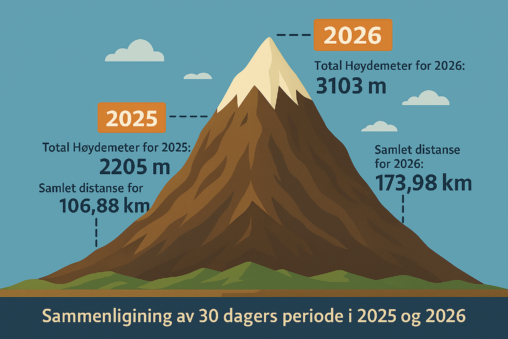
Jeg ba Copilot lage illustrasjon av et fjell hvor det vises tydelig forholdet mellom 2025 og 2026 når tallene er: Total Høydemeter for 2025: 2205 m Samlet distanse…
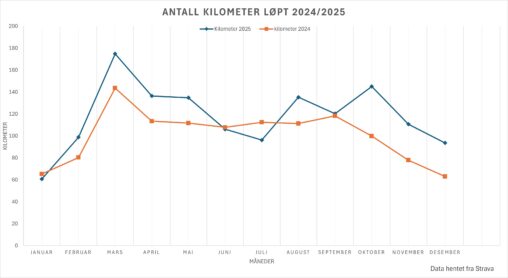
Denne grafen viser månedlig løpedistanse målt i kilometer for 2024 og 2025. Dataen er hentet fra registrerte løpeaktiviteter i Strava. For 2024 dekker tallene perioden fra 1. januar…
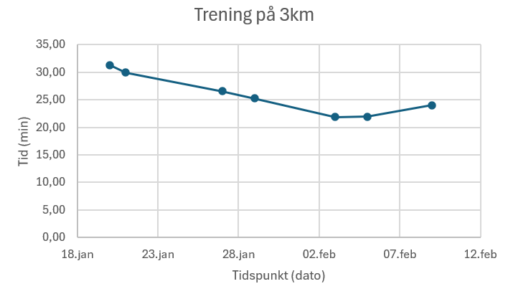
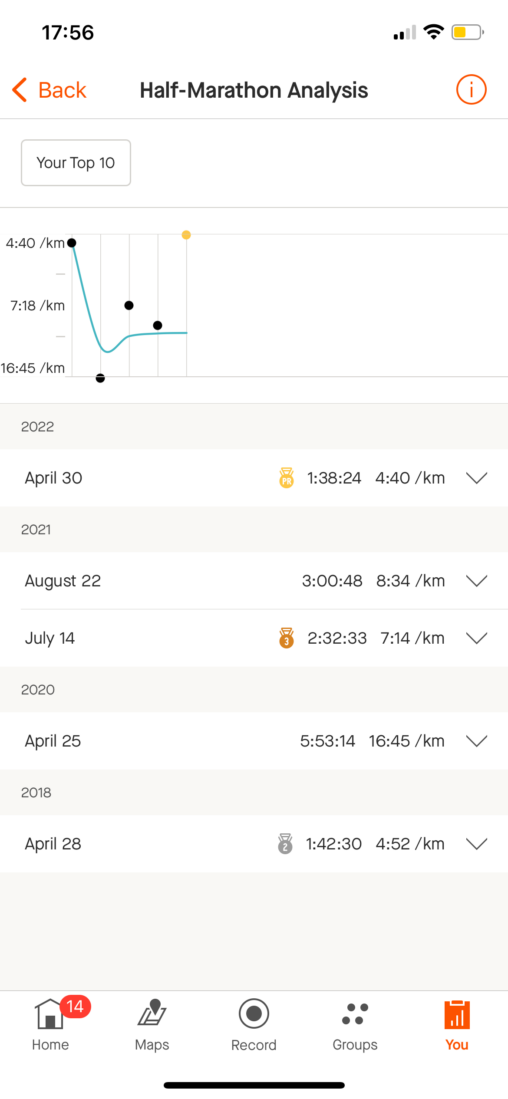
Dataene er hentet fra min egen private profil på strava: Dato, tid og distanse. Y-aksen viser tid (enhet: minutter) og X-aksen viser tidspunkt (enhet: dato). Markørene i feltet…