
3 Data visualizations Tagged "#StepsWalked"
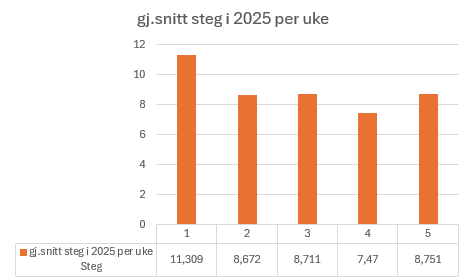
A chart showing the average amount of steps I’ve taken each week in 2025. The y-axis shows steps while the x-axis shows the weeks. Below you will find…
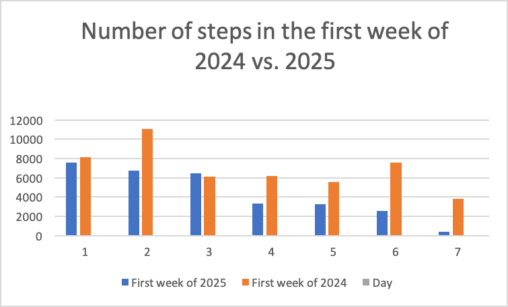
Number of steps walked in the first week in two different years. x- axis shows numbers 1-7 representing days in a week from monday to friday. y-axis is…

The chart shows how many steps I walked each day of the week from 09.09.2024 to 15.09.2024. Copyright status is Public Domain.