
2 Data visualizations Tagged "#steps #10kaday #MyLifeInData"
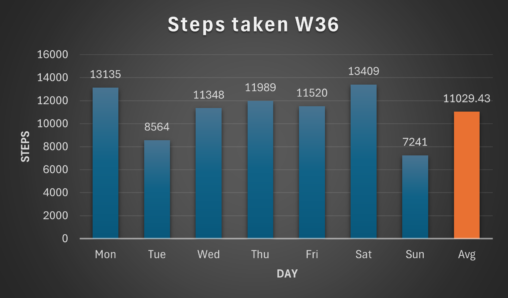
The graph shows how many steps i took each day during week 36. The y-axis shows the amount of steps(0-16000), and the x-axis shows the day correlated to…
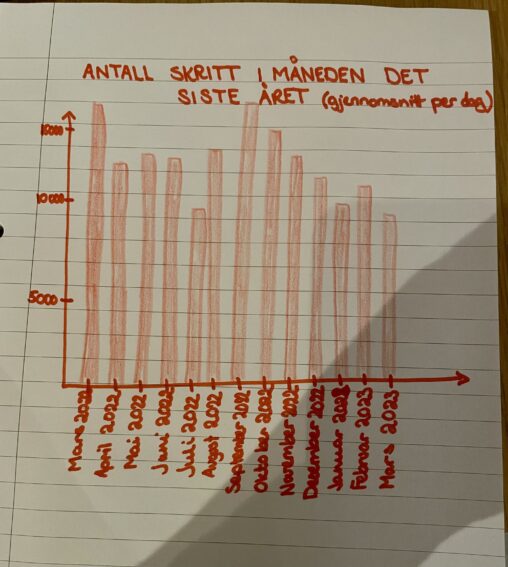
During the last year, I have got a hangup on getting 10 000 steps each day. This is the result of my steps on average per day in…