
12 Data visualizations Tagged "Steps"
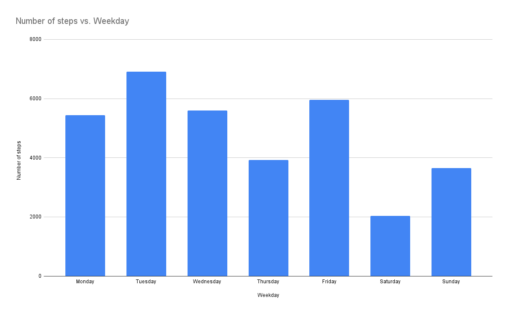
The bar chart visualises the number of steps I took that my digital watch recorded in week 8. The number of steps have been divided into weekdays to…
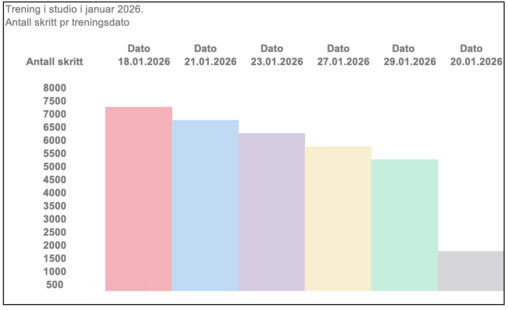
SPENST PROVIDED DATA ON dates I attended the studio. My Oura Ring 4 provided steps per work out session in January
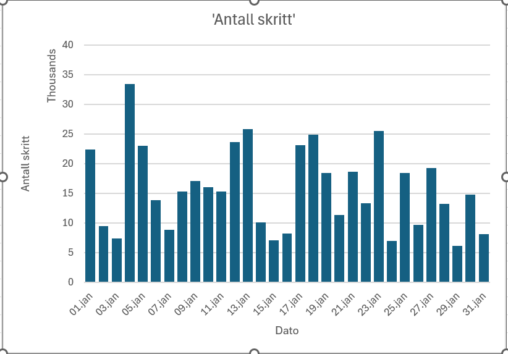
Antall skritt gått per dag i januar. X-aksen viser dato og y-aksen viser antall skritt gått.


My monthly steps. I am the owner of the data. Data is captured from my Garmin watch.

Gjennomsnitt av mine egne daglige målte skritt gjennom ukene 5 til 8 i 2024

Bildet viser gjennomsnittlig antall skritt for januar, februar og desember over 4 år


This graph shows my daily average of steps taken each month of the year 2023. The numbers are represented in averages from up to 10 000 each month…

Two weeks of my daily steps are compared to the amount of rainfall per day measured in my city. The number of steps are displayed as points interconnected…


Average steps i have walked in a week, represented per day (monday-sunday).