
2 Data visualizations Tagged "step count"
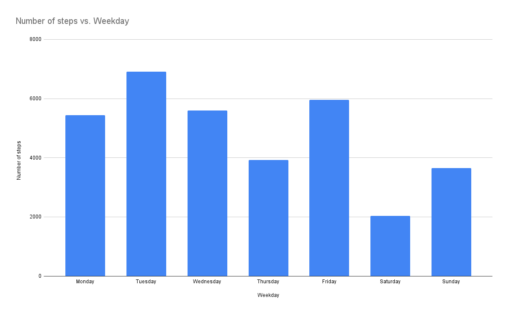
The bar chart visualises the number of steps I took that my digital watch recorded in week 8. The number of steps have been divided into weekdays to…
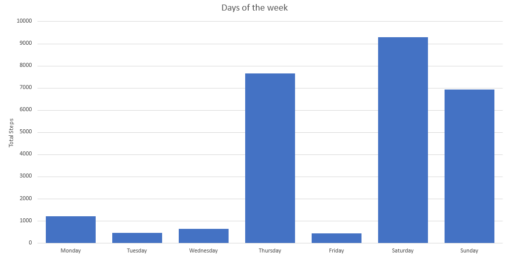
The graph represents the amount of steps walked in the week between December 22nd and December 28th of 2025. The owner of the data represented is myself.