
9 Data visualizations Tagged "Spain"
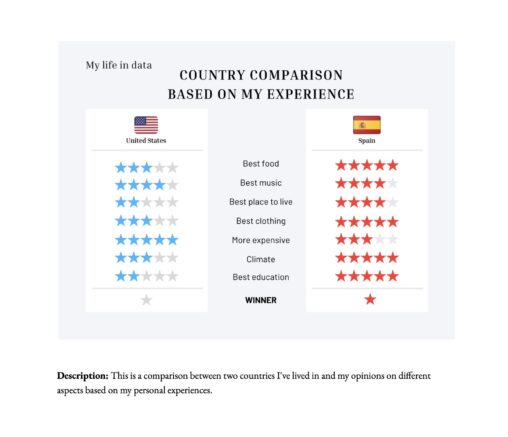
This is a comparison between two countries I’ve lived in and my opinions on different aspects based on my personal experiences.
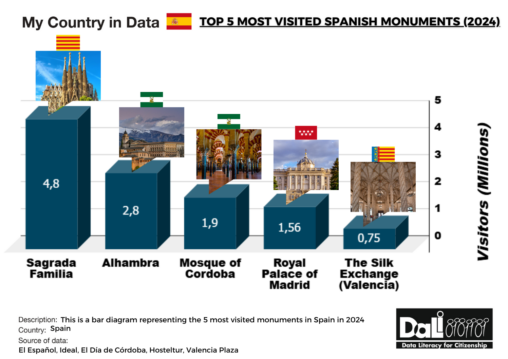
This is a bar diagram representing the 5 most visited monuments in Spain in 2024. The horizontal axis represents the monuments, and the vertical axis, the number of…

In this presentation, I want to share with my classmates and team the different things that I do in my life and the time I spend on those…

Here, it is represented a graph between people from 16 to 74 years old that shows in a visual way the percentage of people that have used the…

Here different interesting data about Spain are represented, such as its area, population, spending on education… taken from different sources such as the National Institute of Statistics or…

Here you can see a timetable that represents the time that I spend each day of the week in the university, with my friends, doing other activities and…

These sets of data represent different aspects about the time and places out of my city (in Spain or abroad) where I travelled to or lived in. Thre…

Annual average snow days in cities I have lived in. Data is from Weather Atlas, which uses different aggregated country resources that can be seen here (open data…

This data visualization shows the number of hats that were collected, each month in 2020, by Seville’s City Council.