
4 Data visualizations Tagged "Sogndal"
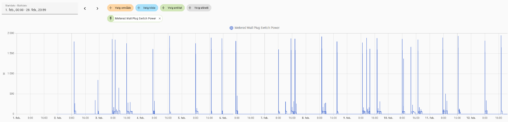
The graph shows the power consumption in watts on the vertical axis, and time on the horizontal axis. Seen together they represent the total power consumption in watt…

Dette er en fruktbarhetsapp som i tillegg til å antyde hvilket kjønn barnet du blanlegger vil få – holder styr på når menstrasjon kommer. Den er enkel å…

I am representing the time I have spent learning, teaching, correcting, calcualting, helping others with and made videoes about mathematics in week 37 in 2023.
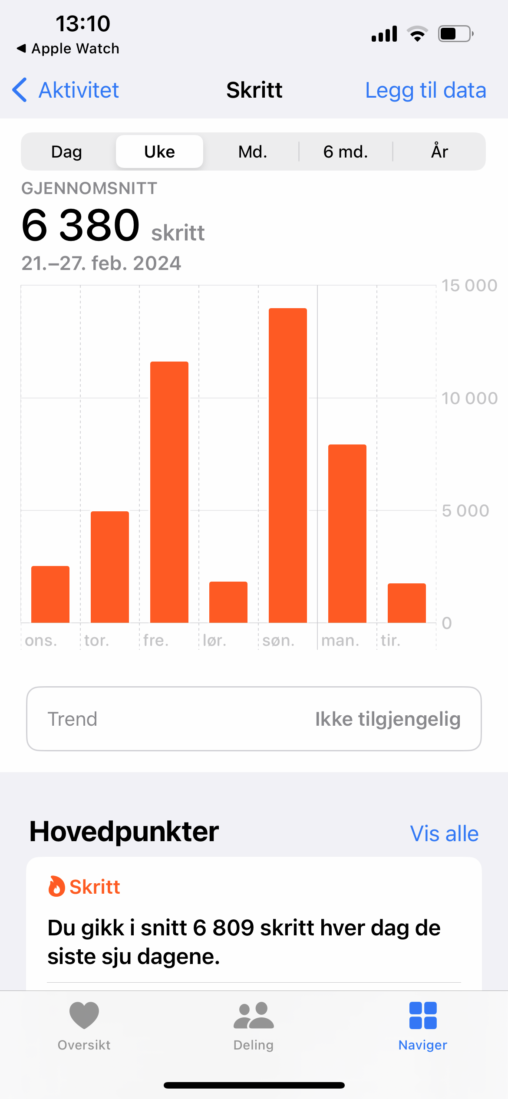
Denne grafen viser antall skritt eg har gått i løpet av ei veke.