
3 Data visualizations Tagged "#socialmedia"
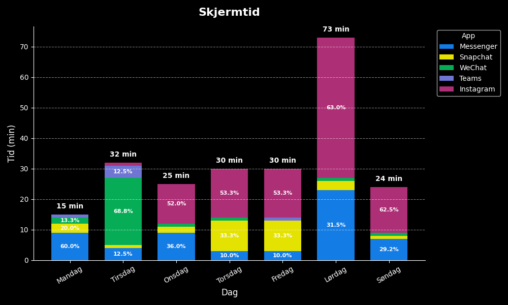
Diagrammet viser data over skjermtid på mobil for ulike apper i løpet av en uke. Tidene er hentet fra mobilen for de respektive dagene og registrert i et…
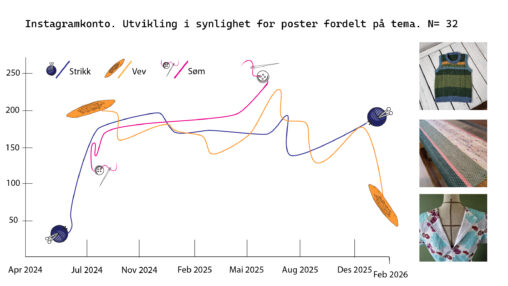
The image shows the development of reach for the Instagram account Trsemakesstuff between June 2024 and February 2026. The account shows images of three different activities: knitting, weaving…
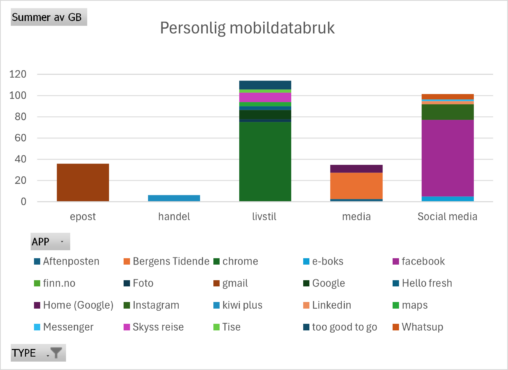
Shows my personal use of mobile data the last month ( in GB ) . Its fetched from my mobile device into a workbook and visualized. The data…