
3 Data visualizations Tagged "social media"
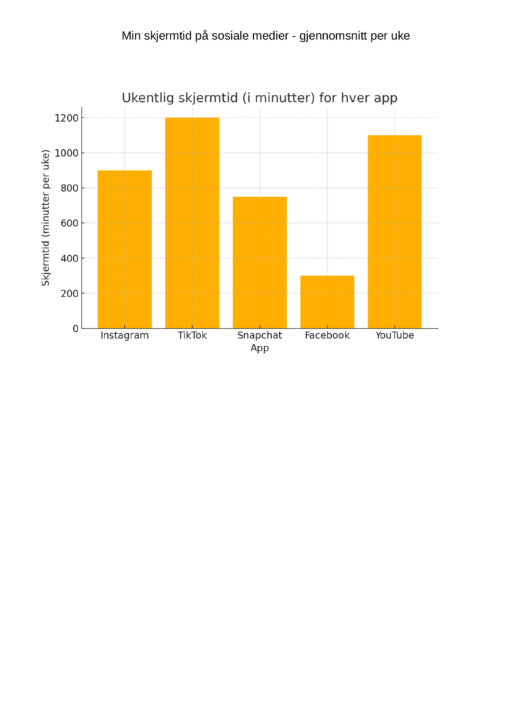
This data visualization is a bar chart representing the average weekly screen time (measured in minutes) spent on various social media platforms. The platforms included in this visualization…
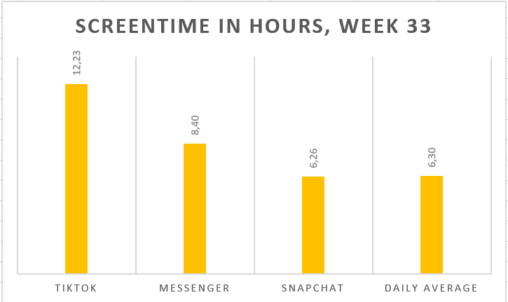
An overview of my screentime durring week 33, including my most used applications.

A bar chart over how many hours/minutes a day I spend on my job and on my phone in a particular week. Time on the phone include private…