
18 Data visualizations Tagged "sleep"
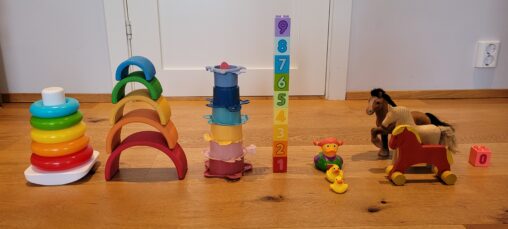
Number of times my daughter has woken me up during the night the seven last nights represented through her toys.
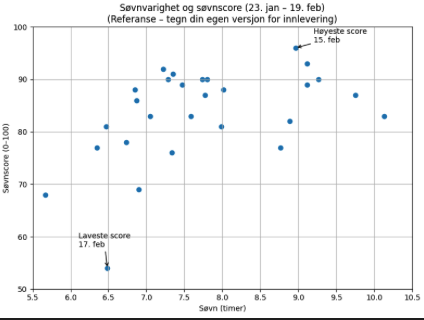
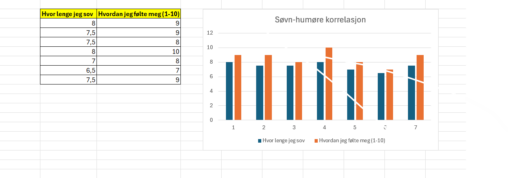
Visualiseringen viser min registrerte søvn i perioden 23. januar–19. februar. Hvert datapunkt representerer én natt og viser forholdet mellom søvnvarighet (timer og minutter omregnet til timer på x-aksen)…
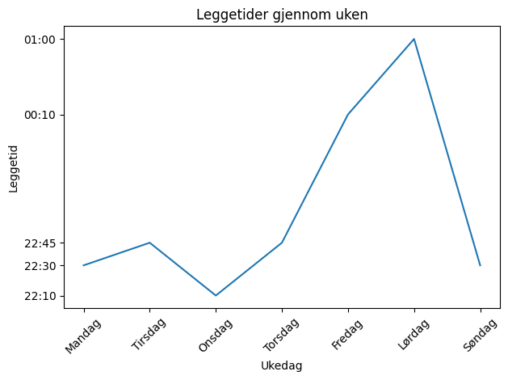
This graph was created in Excel and illustrates my bedtime patterns during the period 09.02–15.02.2026. All times are presented in 24-hour format. Shows a clear visual of late…
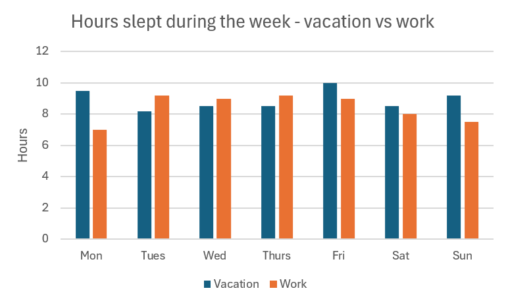
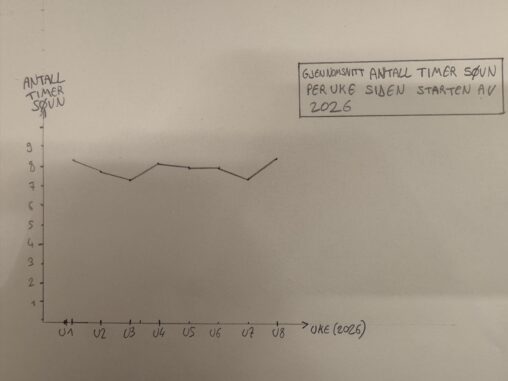
Amount of hours slept per day, from Monday through Sunday, taken from week 1 2026 while I was on vacation, and week 2 2026 when I was back…
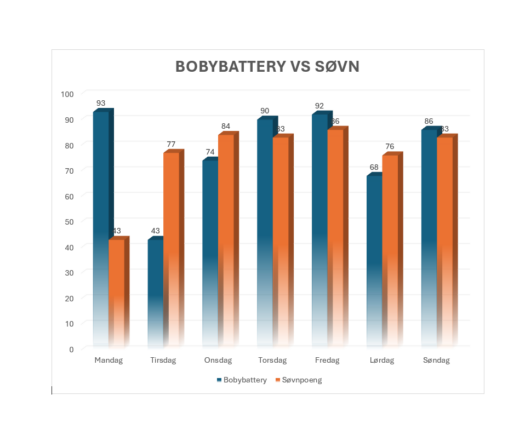
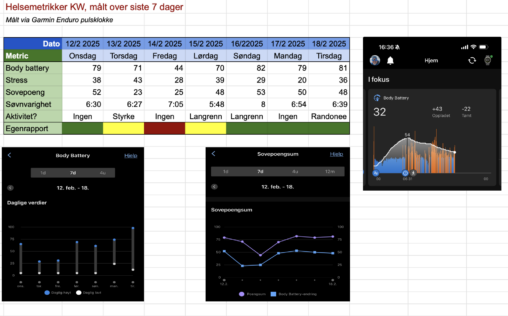
Denn grafen illustrerer ulike helsemetrikker hentet ut fra min Garmin-klokke som følger meg 24/7. Her registreres foruten ulike helsemtrikker min fysiske aktivitet og jeg kan måle hvordan mitt…
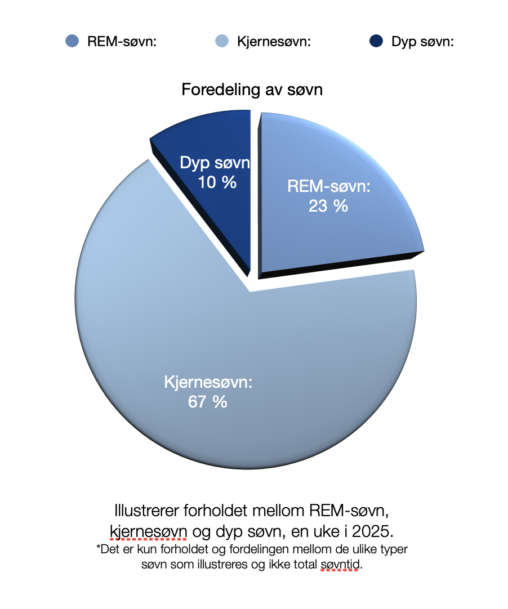
Illustrerer forholdet mellom REM-søvn, kjernesøvn og dyp søvn, en uke i 2025. *Det er kun forholdet og fordelingen mellom de ulike typer søvn som illustreres og ikke total…
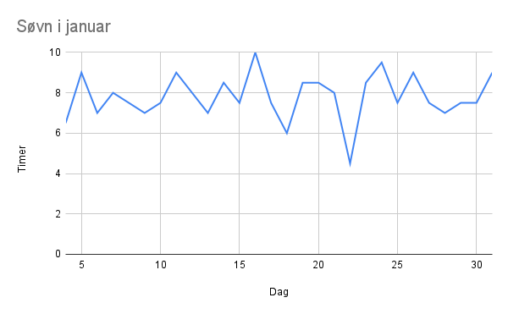
Jeg har brukt apple smart watch fra 4.jan til 31.jan som har følgt søvnen min hver dag. Har i dette diagrammet ført inn data for nærmeste halvtime.

Amount of hours of sleep per day and hours of screen time per day are represented in a bar diagram. The blue bars represent hours of screen time,…

Søvnfaser målt med min Apple Watch i uke 8. Fasene er i prosent av total søvnlengde.

How many hours of sleep per day am I getting? As a runner, my sleep and restitution affects my planned intencity during training sessions.Balance is key.

The image is a representation of how many hours and minutes i slept every night in week 3 in 2024. The data was collected from my digital watch,…

Denne dataen er en oversikt over hvor mange timer søvn jeg har fått hver dag i januar 2024. Denne dataen har jeg hentet fra egne observasjoner.

Møtte søvnmålet 6/7 dager, bortsett fra 27.januar. Det manglet fem minutter fra åtte timer.

The visualization shows my own sleep data so far in the current month (jan 2024) as hours per night between the day before to given day of month….

Timer søvn fra 16. april til 16. mai 2022. Viser også snittid i løpet av perioden.