
5 Data visualizations Tagged "#RICT2425 at the UM"

In this three graphics I’ve presented myself, as an active, classic and funny person, represented with my steps, my clothes and my leisure.
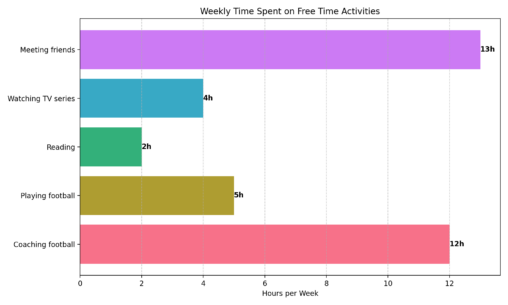
This graphic represents the distribution of how do I spend my free time along the week.
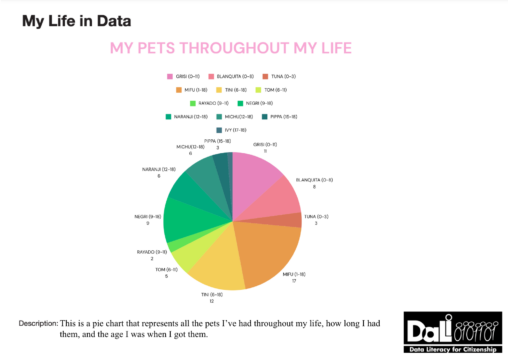
This is a pie chart that represents all the pets I’ve had throughout my life, how long I had them, and the age I was when I got…
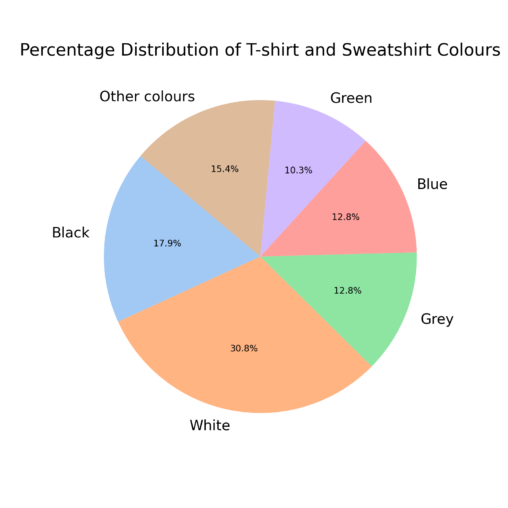
This percentage graph represents the colours of the top garments I have in my wardrobe; the ones with the highest percentage are also the ones I use the…
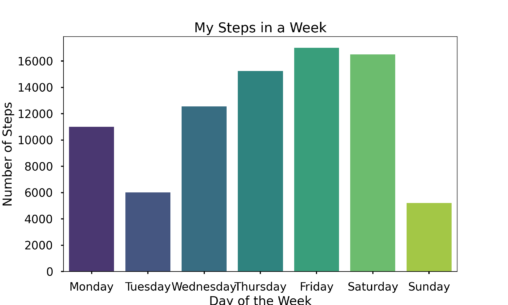
This graphic represents the number of steps of a normal person that goes to the university five times a week and also works as a football trainer three…