
2 Data visualizations Tagged "productivity"
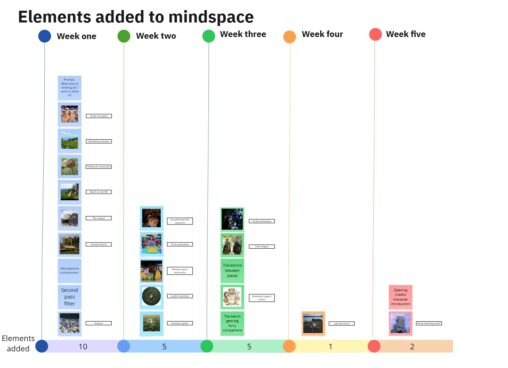
I have been developing a mental landscape with places, characters, and features to assist me in my cognitive functioning. This graph shows the elements I’ve been adding week…
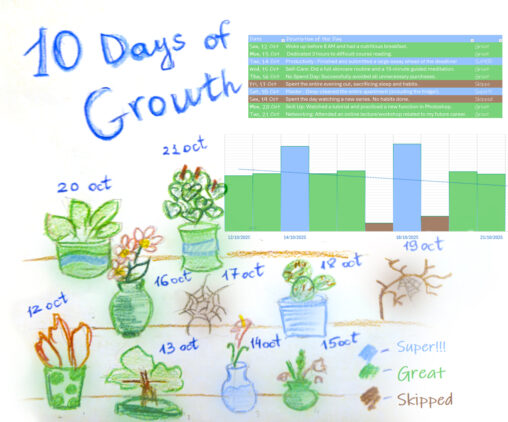
This is my personal habit tracker for 10 days – from October 12 to October 21, 2025. I visualized my progress through the metaphor of growing plants because…