
3 Data visualizations Tagged "piechart"
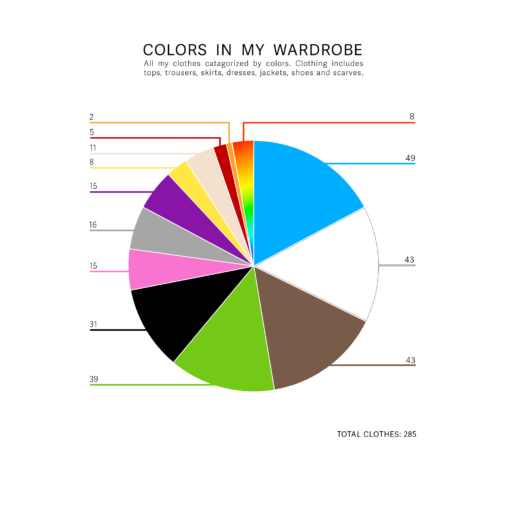
Et sektordiagram som kategoriserer mine egne klær etter farge. Klærne inkluderer topper, bukser, skjørt, kjoler, jakker, sko og skjerf – totalt 285 plagg. Diagrammet er fremstilt i en…

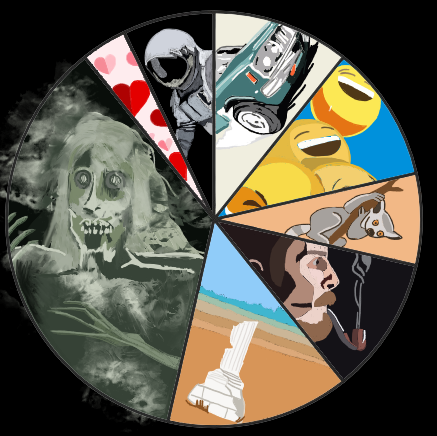
I used my film diary from https://letterboxd.com/ to find out which film genres I watched the most, and the least, during a year. I chose to present it…