
3 Data visualizations Tagged "Phone"
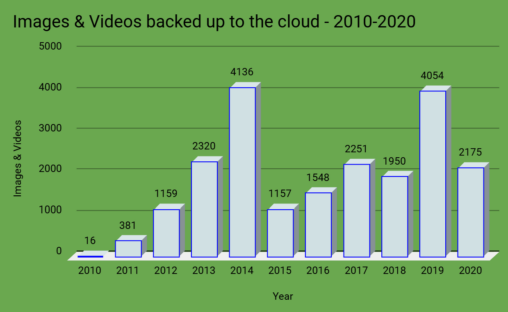
In 2010, I started automatically uploading all my photos and videos to Dropbox from my phone. Since then, the amount of images I’ve taken has increased dramatically. It’s…
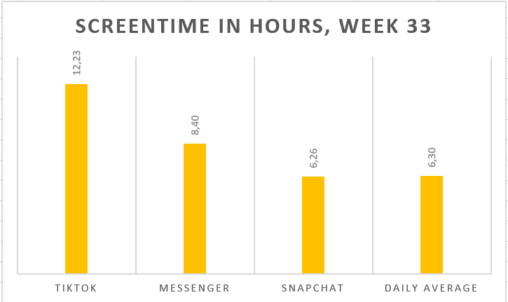
An overview of my screentime durring week 33, including my most used applications.

I’ve represented the average time I spend with my phone during weekdays. I show the average screen time during a period of hours. I used units of time,…