
5 Data visualizations Tagged "personal spending"
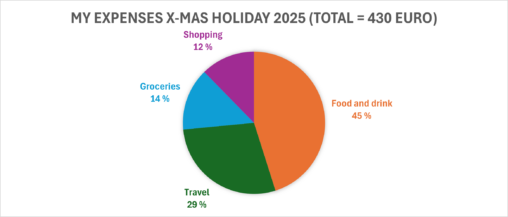
Expenses in euro’s during Christmas holiday divided in main categories. Personal expenses from bank account. No copyright and anonymised. Made in excel.
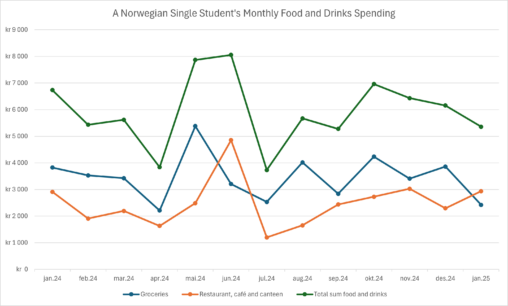
The visualisation is showing the monthly food and drinks spending from January 2024 to January 2025 in Norwegian kroner. Food and drinks are split into two categories: groceries…
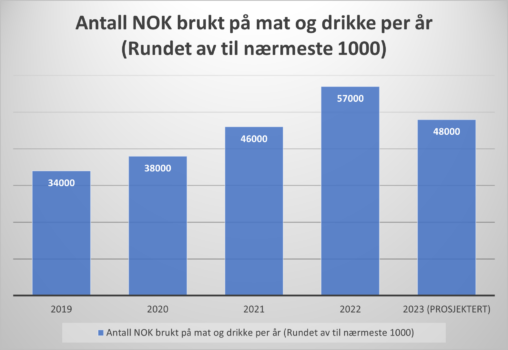
Amount of NOK spent on food and drink per year, rounded to the nearest thousand From year 2019 to 2023
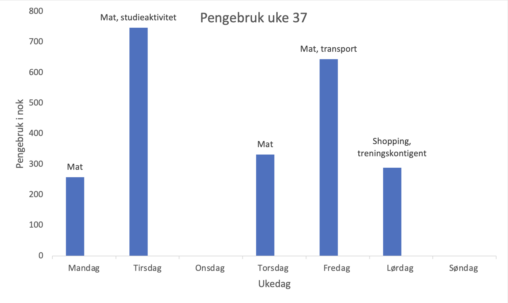
Denne tabellen viser hvor mye penger jeg brukte hver dag i uke 37. Jeg har denne måneden hatt fokus på å spare, og det har gått så som…
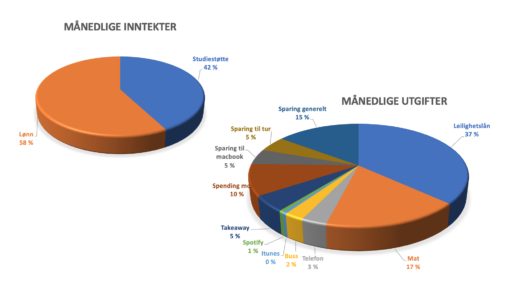
This provides information given in percentages about my two incomes and relative to that how many percentages of my income I spend on each of my expensecategories. The…