
19 Data visualizations Tagged "Oslo"
This visualization represents the historical price performance of the Cardano ESG Transition Equity Europe fund (ticker: AVEA, ISIN: NL0010579074), listed on Euronext Amsterdam and managed by Cardano Asset…
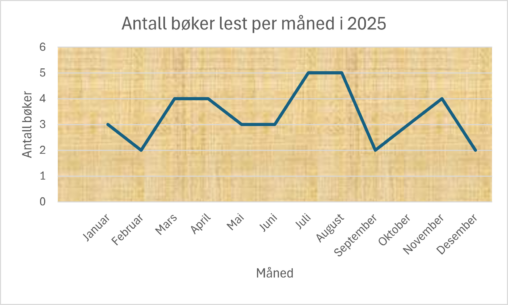
Books read by me from january to desember 2025 Iam the owner -14,02,2026
Eier av data er Irene Høyland Berg. Viser en oversikt over mine treninger hos Sats gjennom et år og hvor mye hver enkelt time koster meg gjennom et…
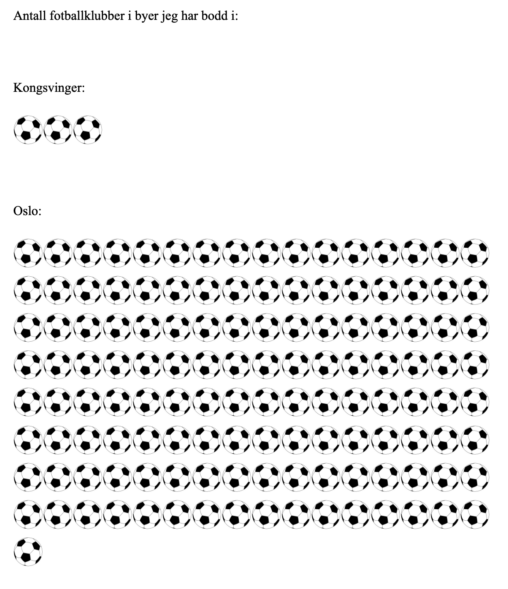
Open Clip Art Library (https://no.wikipedia.org/wiki/Fotball_%28ball%29#/media/Fil:Soccerball.svg)
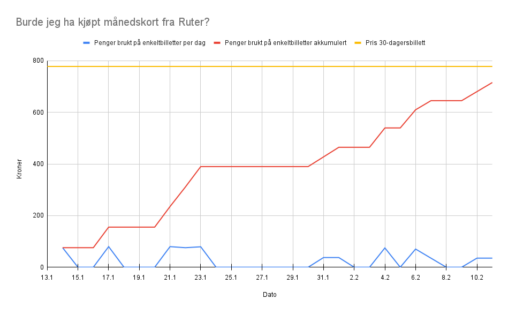
The diagram is showing the amount of money (in kroner) an individual has spent on public transportation over 30 days (Jan 13th to Feb 10th 2025), compared to…
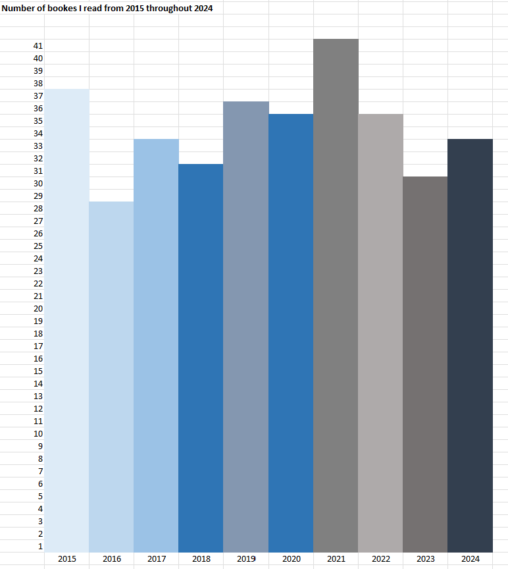
The Excel sheet shows the number of books I read from 2015 throughout 2024. The numbers are based on notes I’ve made on my phone.
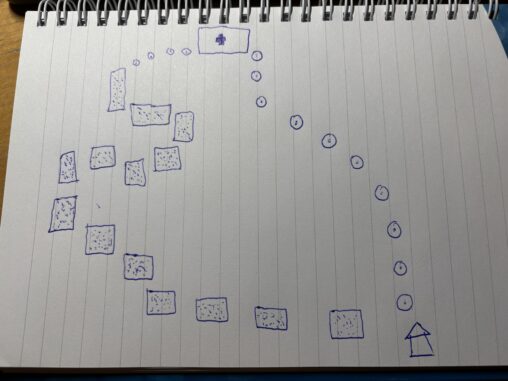
An image showing the pings of the phones on my two alternative routes for work. The circles represents me. One route is by bicycle going alone. The other…
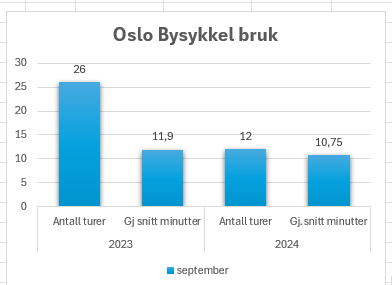
Jeg bruker bysykkel og har hentet statistikk fra appen min. Visualiseringen viser antall sykkelturer og gjennomsnittelig bruk for september i 2023 og 2024

Sammenligning av antall personer innenfor spesifikke aldersgrupper, fra 19-90 år +, i bydel Nordstrand og Oslo under ett. Data er hentet ut i fra bydelsfakta, Oslo statistikken, publisert…

Gjennomsnittstemperaturen i Oslo i januar har økt de siste årene, og 2023 var den mildeste januarmåneden siden 2009. Dette er i tråd med den globale trenden med temperaturstigning….

Procent change of squaremeter price for flats in Oslo VS procent change of income.

Grafen kombinerer to datakilder, begge for perioden 22.1.2024-21.2.2024: – Punktlighet for pendlertog i Oslo, uttrykt i prosent, fra Bane Nor: – Nedbør i mm for Blindern målestasjon i…

The chart showes the population density (2024) for norwegian municipalities I have lived for more than 1 year during my life. The orange line showes the share in…


Søylene viser en sammenligning av middeltemperatur i juli i Bergen og Oslo fra 2013 til 2023

Verdiene viser antall døgn det har regnet, ifølge målestasjonene Yr.no bruker i de forskjellige byene. Opphavsrett © NRK og Meteorologisk institutt 2007–2023
