1 Data visualizations Tagged "Norwegian author"
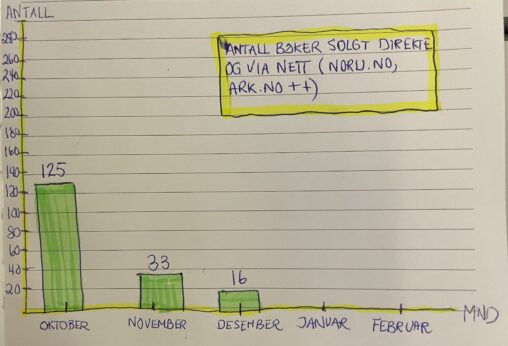
This visualization shows the number of copies of the poetry collection sold per month in Q4 2025. The data represents total units sold (number of books) through direct…

A SPLOT on the Web: DALI worlds.
Blame @cogdog for the TRU Collector Theme, based on Fukasawa by Anders Norén.
This visualization shows the number of copies of the poetry collection sold per month in Q4 2025. The data represents total units sold (number of books) through direct…