
82 Data visualizations Tagged "norway" (page 4 of 5)
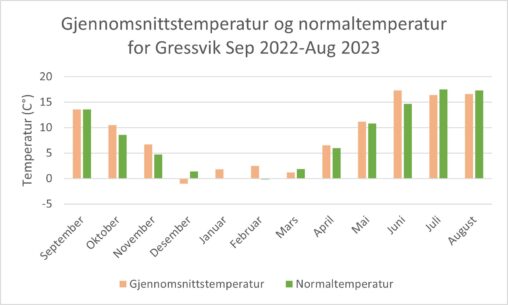
Mean and normal temperatures in celsius of Gressvik in Norway from September 2022 to August 2023 represented in a graph.
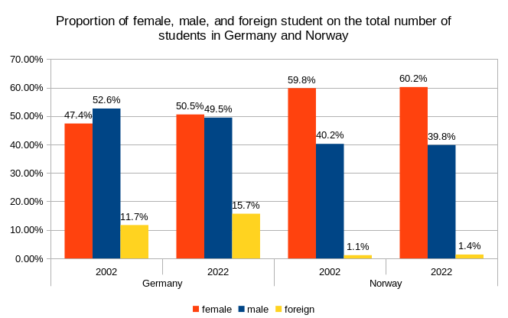
Percentages of female, male, and foreign students relative to the total student population. One fact that rather astonished me was that much more females than males were studying…
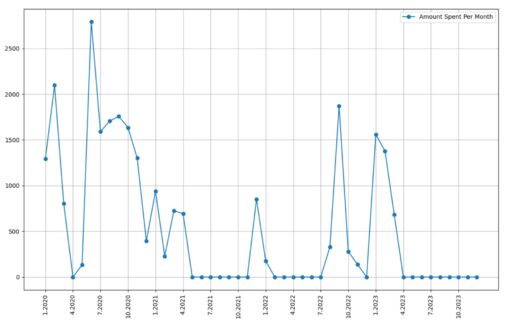
shopping data downloaded from Trumf. Each point represents a month with the Y-axis representing how much I spent in that month. Plotted using python. Funnily, it shows when…
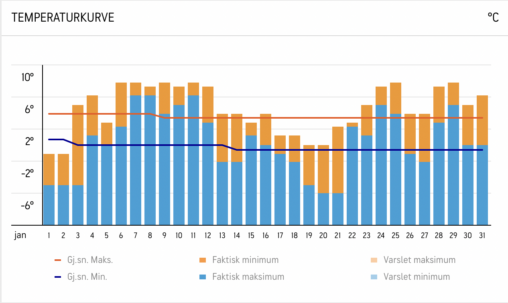
Grafen viser en oversikt over hvordan temperaturen i Bergen har variert i januar måned. © 2023 AccuWeather, Inc. “AccuWeather” og sun design er registrerte varemerker som tilhører AccuWeather,…
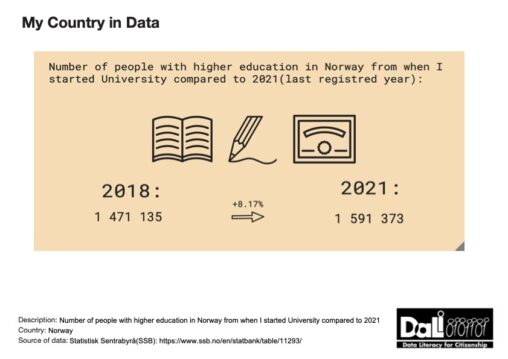
Illustration of people with/attending higher education in Norway in the year 2018 and the year 2021, including the rise in percent. The source and owner of the data…

An AI-generated image based on the interpretation of my exercise data for 19-25 February 2023, where I ran, went hiking and skiing in the mountains.
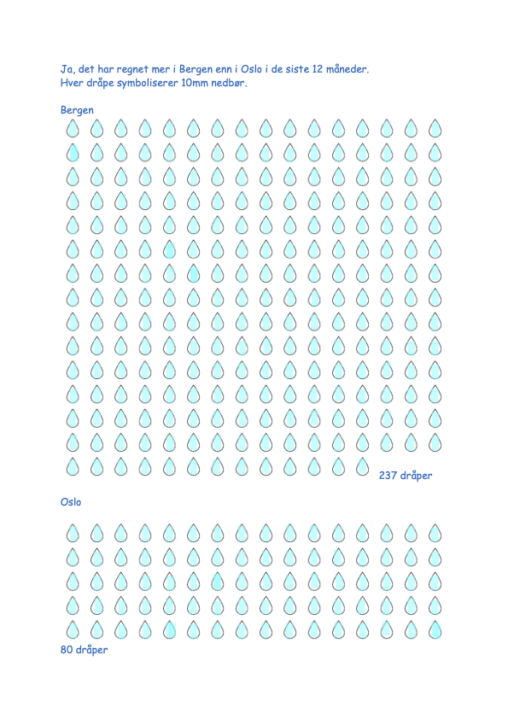
Bildet viser hvor mye det regnet i to byer i Norge i de siste 12 måneder. hver dråpe indikerer 10mm nedbør. På denne måten ser man tydelig hvor…
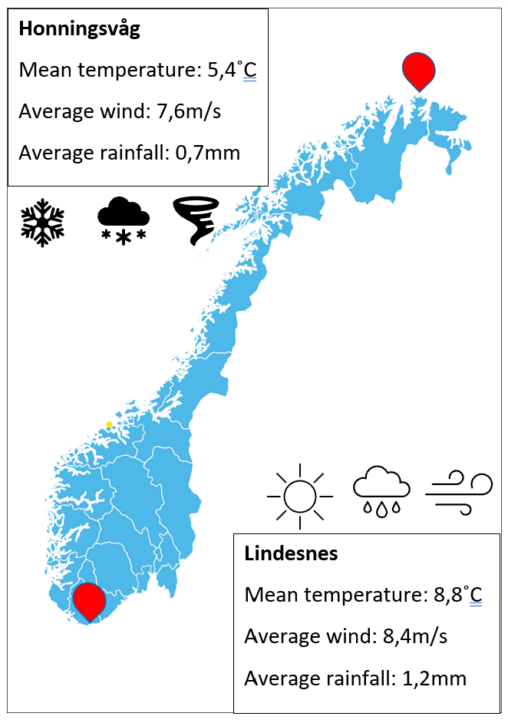
Weather at the southernmost- and northernmost point i Norway, by mean temperature, average wind speed and average rainfall of 2022. The data is collected by “Norsk klima service…

In the age group 15-74 years, 2 818 175 in total were working in Norway in 2022. The table shows how these numbers are divided by fylker where…
https://www.ssb.no/en/statbank/table/06913/tableViewLayout1/
https://www.ssb.no/en/statbank/table/06913/tableViewLayout1/
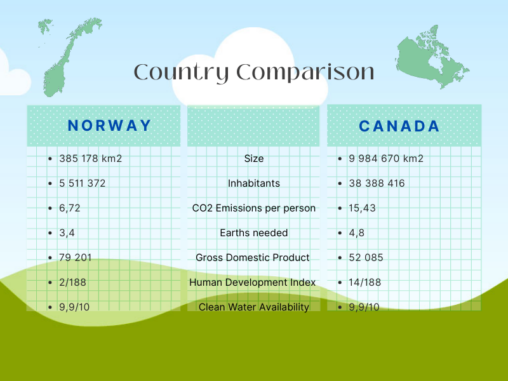
Data represented: Size Inhabitants CO2 Emissions per person Earths needed Gross Domestic Product (GDP) Human Development Index (HDI) Clean Water Availability
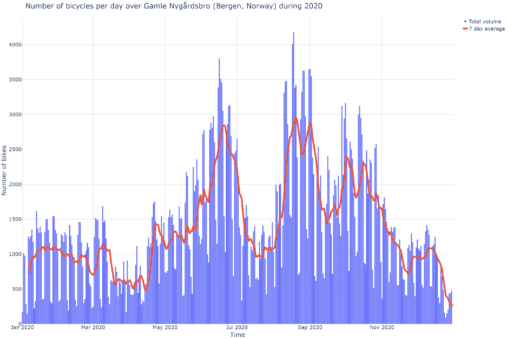
The visualisation is a graph showing the daily number of bicycle crossings in 2020 (early Covid-19) over a measuring point set up by The Norwegian Public Roads Administration…
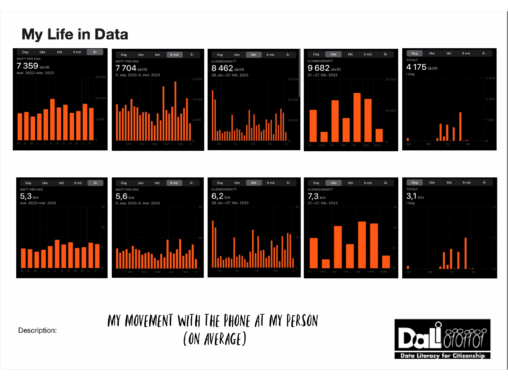
Average steps and distance traveled (by foot) in different intervalls. As it is recorded by iPhone, it means steps and distance traveled with iPhone with me.
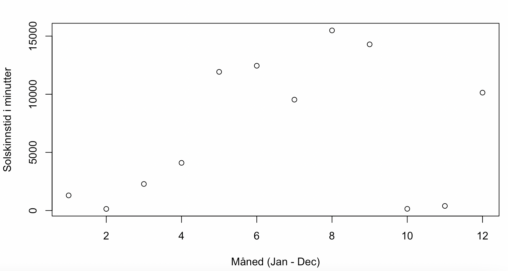
This data represents the total amount of sunshine in city full of rain. The data used is from the Geophysical Institute at the University in Bergen.
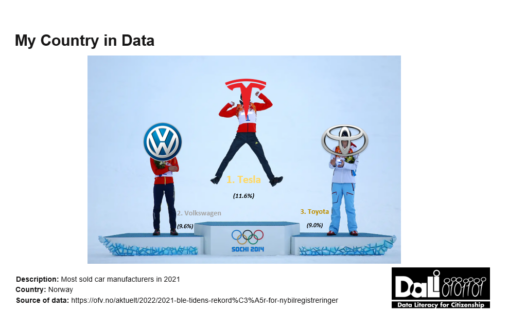
Visualization of the top three car manufacturers in Norway (2021) by the percentage of total car sales. Background photo: https://www.businessinsider.com/best-medal-winning-reactions-sochi-olympics-2014-2?r=US&IR=T
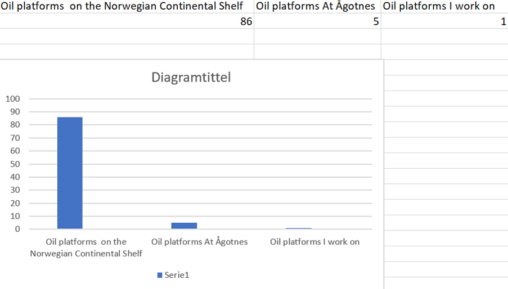
There are 86 oil platforms on the Norwegian Continental Shelf. Ågotnes located on Sotra have 5 oil platforms at dock per at the moment (28.08 2022). 1 of…

Visualiserer den totale nedbørsmengden i Bergen de siste 12 månedene (August 2021-Juli 2022). Dataene er hentet fra yr.no sine sider: https://www.yr.no/nb/historikk/tabell/1-92416/Norge/Vestland/Bergen/Bergen?q=siste-13-m%C3%A5neder
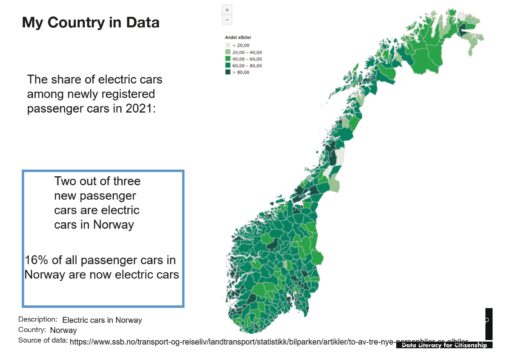
Share of electric cars in Norway among newly registered passenger cars in 2021