
82 Data visualizations Tagged "norway" (page 2 of 5)
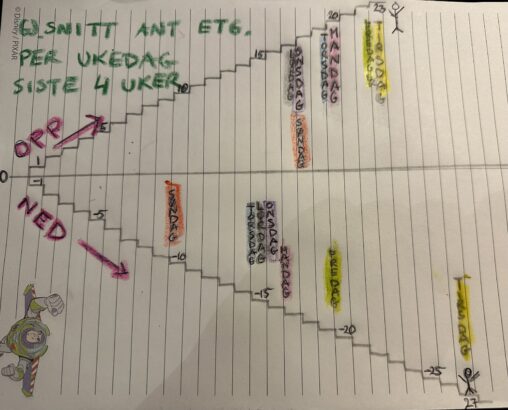
Data from my Garmin Watch from 20 January 2025 – 16 February 2025. Presented as average number of floors per weekday. Owner of data: The Garmin Watch User…
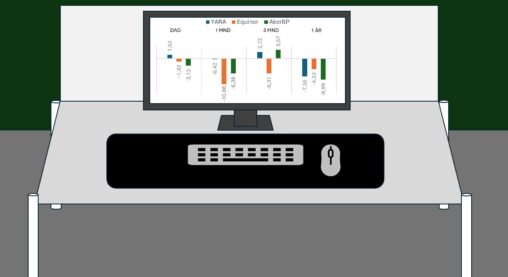
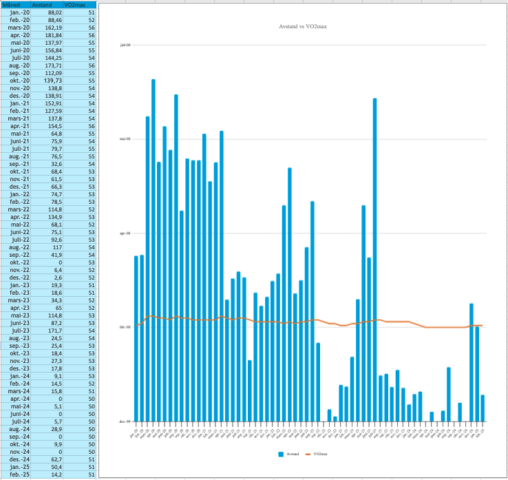
The image represents my desk at work. The graphic content on the monitor discribes the movements the last day(17.02), last month, last 3 months and last 12 months…
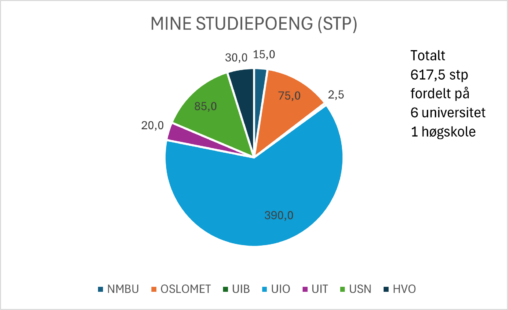
THE PIE DIAGRAM VISUALIZES AT WHICH UNIVERSITIES AND COLLEGES I HAVE STUDIED IN NORWAY AND HOW MANY CREDITS I HAVE TAKEN AT EACH INSTITUTION. TO GET A GOOD…
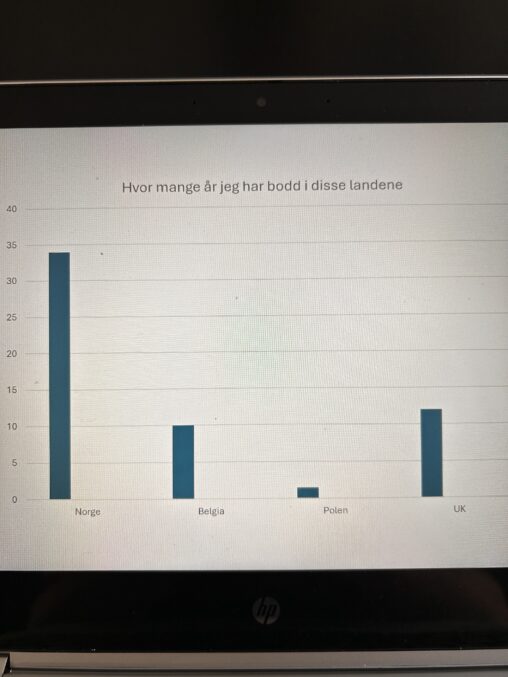
How many years I have lived in each of the four countries mentioned Own data
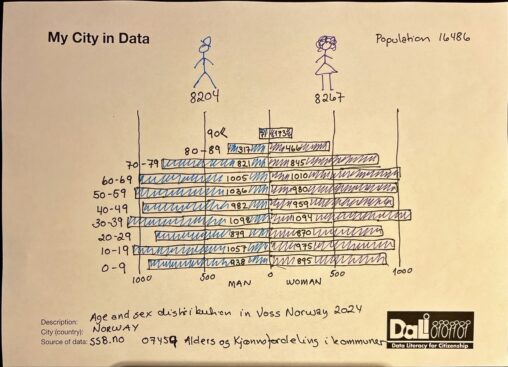
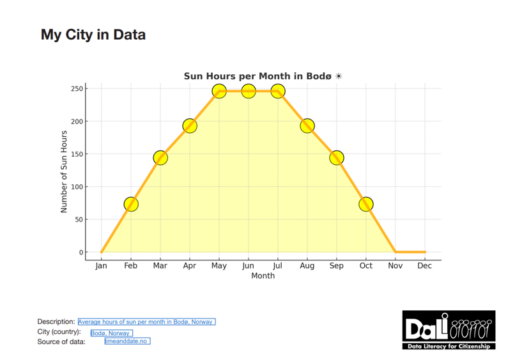
Based on data from SSB.no table 07459: Alders- og kjønnsfordeling i kommuner (age and sex distribution in municiplitis by year). Selected data from municipality of Voss and year…
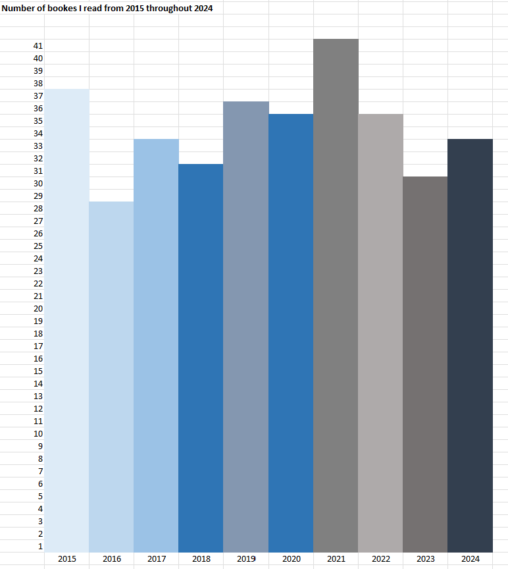
The Excel sheet shows the number of books I read from 2015 throughout 2024. The numbers are based on notes I’ve made on my phone.
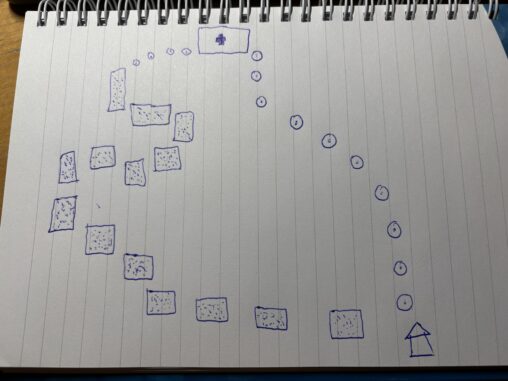
An image showing the pings of the phones on my two alternative routes for work. The circles represents me. One route is by bicycle going alone. The other…
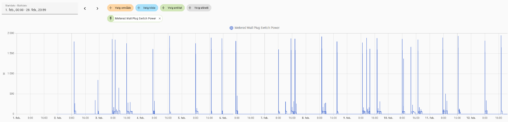
The graph shows the power consumption in watts on the vertical axis, and time on the horizontal axis. Seen together they represent the total power consumption in watt…
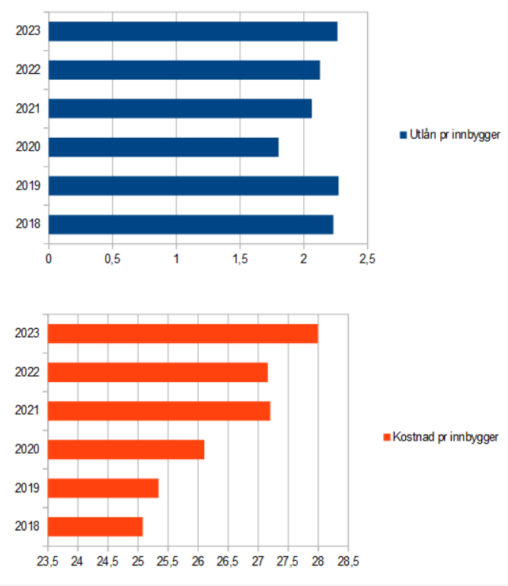
Grafene viser antall utlån av bøker i norske folkebibliotek sett opp mot mediebudsjettet fordelt pr innbygger for perioden 2018-2023. Tallene er hentet fra SSB.
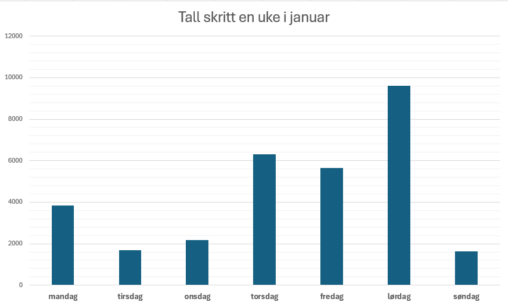
Dette viser hvor mye skritt har jeg gjort hver dag gjennom en uke i januar.
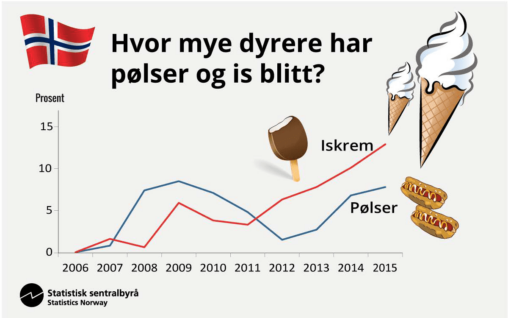
Data Visualization Description Title: Ingen 17. mai uten pølser og is! Description: This data visualization illustrates the price growth of sausages (pølser) and ice cream (iskrem) over the…
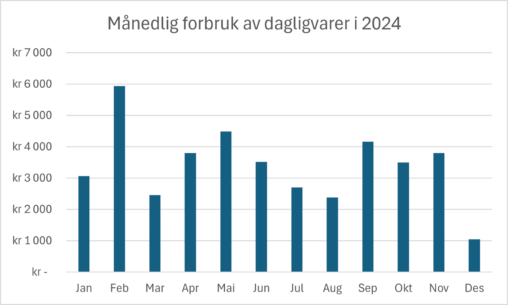
Stolpediagram over mitt månedlige forbruk av dagligvarer i kroner for 2024. Personlig data.
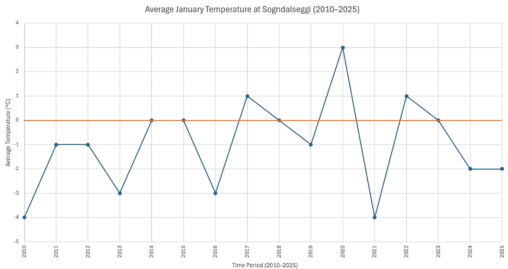
This chart shows the average January temperature at Sogndalseggi from 2010 to 2025, based on data from timeanddate.com. The x-axis represents years (2010–2025), and the y-axis shows temperature…
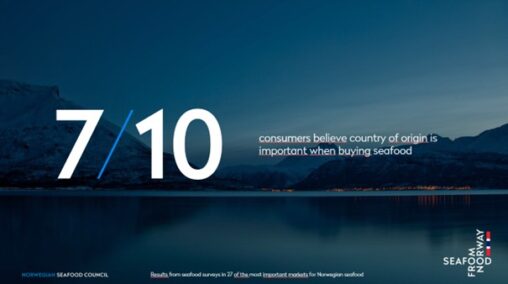
Undersøkelser fra de 27 viktigste markeder for norsk sjømat. Kilde: Norges Sjømatråd.

A trout fish in local freshwater outside of Bergen was examined for internal parasites.The trout was found to have approximately 60 capsules of the parasites inside. Dibothriocephalus ditremus…

Kor mange koppar/glas med ulik type drikke eg har drukke i løpet av ei veke.

Does good sleep buffer against stress? I looked at one week in June 2024 in the Apple Health and Stress Monitor apps on iPhone and was surprised at…

En uke med skjermtid. Visualiserer total skjermbruk hver dag, sammen med hvor lang tid jeg har brukt på mine mest brukte apper; Snapchat, TikTok og Candy Crush.