

4 Data visualizations Tagged "#myworkouts"
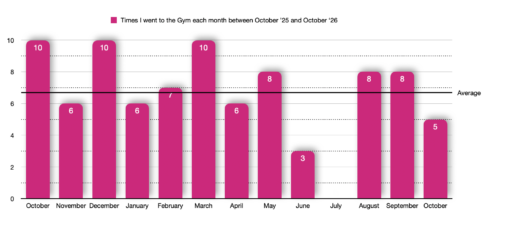
This graph gives an overview of the amount of times I worked out in the gym in the last year in each month. The time period is between…

Shows the kilometers i have run in the period. The runs that have been done with a running group are marked with a red dot

Stolpediagrammet viser hvordan tiden brukt på trening har utviklet seg over de siste 10 årene, med sammenligning av treningstimer i 2015 og 2025. For 10 år siden var…
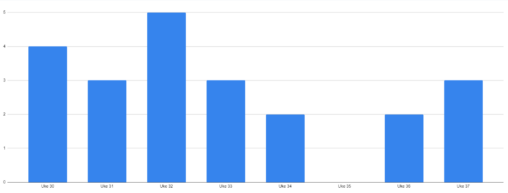
Hours worked out per week, for the last 8 weeks. Dips are from being sick and from having more work(employment).