
40 Data visualizations Tagged "#MYLIFEINDATA" (page 2 of 2)

Here is my music listening history for a day, sorted into the songs name, the artist, the song duration and what genre it fits into.

I used Microsoft Excel to type in and create a bar chart using the chart tools. https://www.microsoft.com/nb-no/microsoft-365/excel?market=no

My phone has an app for health realted information it has gathered about me. I don’t think at all the information in the sleep app is accurate, or…

Grad av utadventhet som varierer i løpet av ukedagene.

A representation of the different literary genres I read in 2022 visualised in the amount of books read per genre.

This is a representation over my finished knitting project each month from September 2020 until September 2023.

This is taken from my journal, where I´ve collected data about my daily habits – if I´ve been able to do them or not, if I´ve slept well…

This is a visualization of my travel journey in 2022 and shows how many days i have been away from home (Norway).

An AI-generated image based on the interpretation of my exercise data for 19-25 February 2023, where I ran, went hiking and skiing in the mountains.

According to my mobile data, this is the average time that I listen music during a month, actually during January.

In this presentation, I want to share with my classmates and team the different things that I do in my life and the time I spend on those…

I have made a brief study on which are the routes that I frequent the most with the different distances and times that are needed to travel them,…
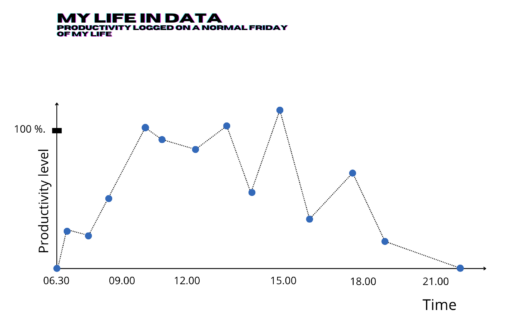
Productivity logged from the time I woke up to when I went to bed on Friday 26.08.2022. The productivity level also reflects the level of energy at various…
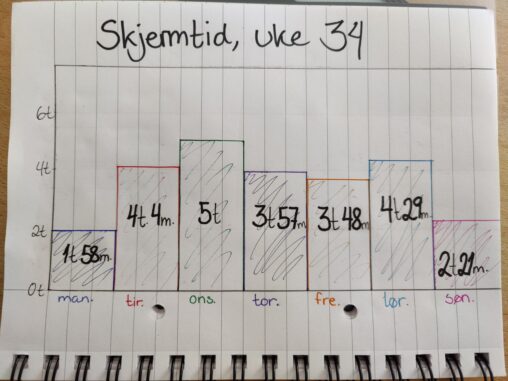
Bildet viser en visualisering av hvor mange timer og minutter jeg har brukt aktivt på mobilen, hver dag i uke 34. Dataene er hentet fra min egen telefon.
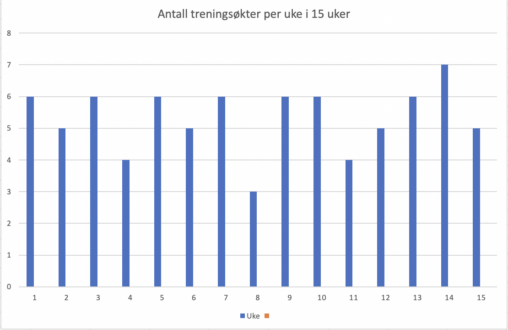
Dette er en oversikt over hvor mange ganger jeg har trent på Sammen treningssenter i bergen over de siste 15 ukene og hvor mange ganger i uka jeg…

My mood during the week, the glasses of water that I drink every day and the hours of sleep every day for a week.

In this graph I show the hours I dedicate to one of the things I love to do most in the world, teaching.

This drawing shows the amount of time a day I spend in music. 1 star represents 1 hour. I have included lessons/rehearsals, study at home, reading, and listening…


These sets of data represent different aspects about the time and places out of my city (in Spain or abroad) where I travelled to or lived in. Thre…