
40 Data visualizations Tagged "#MYLIFEINDATA" (page 1 of 2)
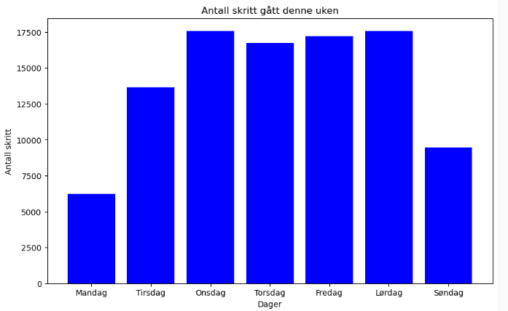
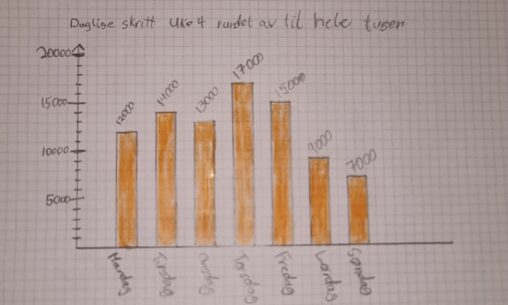
Bildet viser grafer av antall skritt gått i uke 7, 2025. Målet denne uken var å øke skrittmengden fra 10000 til minimum 13000. Data er samlet inn via…
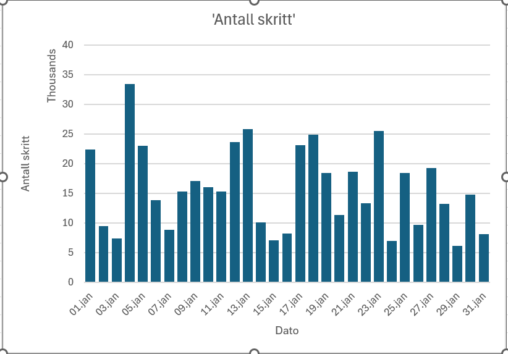
Antall skritt gått per dag i januar. X-aksen viser dato og y-aksen viser antall skritt gått.
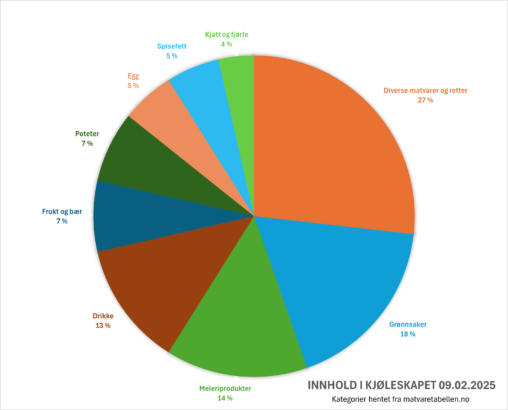
Categories are from matvaretabellen.no as public domain. All other data is my own. The diagram contains data of my refrigerator content on February 2nd, 2025. The data in…
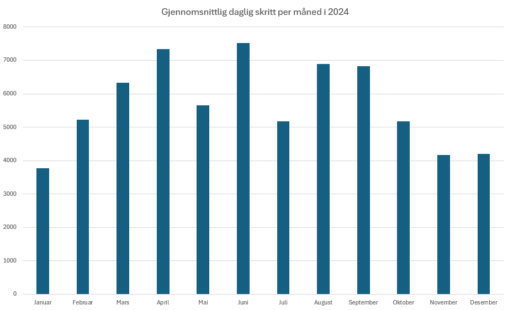
Det gjennomsnittlige antall skritt jeg gikk per dag er representert for hver måned.

Diagrammet viser antall timer brukt på å lese i fem ulike emner ved UiB i perioden 1. januar til og med 28. januar. Enhetsformen brukt er timer. Diagrammet…
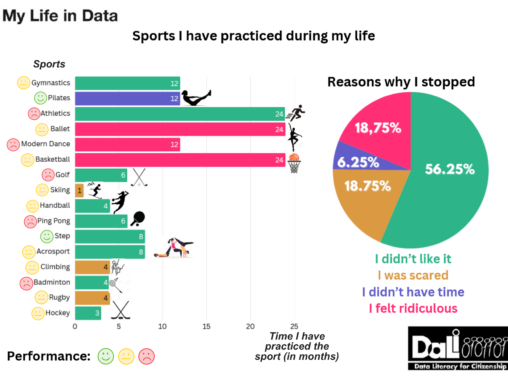
In this image I represent the sports I have practiced during my life using a horizontal bar diagram to show the time I have practiced each sport in…
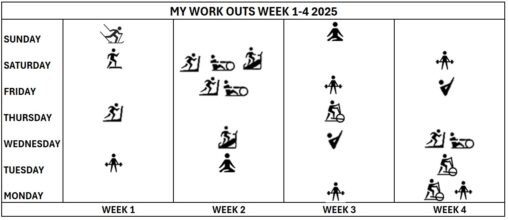
An overview over the different types of workouts I have done/will do in week 1-4 2025. I am the owner of the data represented, the illustrations for the…

The chart shows how many steps I walked each day of the week from 09.09.2024 to 15.09.2024. Copyright status is Public Domain.

Dette er hvor mange timer jeg har brukt på telefonen sist uke (uke 36). Visualiseringen er laget i excel.

My monthly steps. I am the owner of the data. Data is captured from my Garmin watch.


Mitt private analoge bibliotek 2024 delt opp i seks genre. Lisens: CC BY-SA 4.0 Billedelementer: DALLE-3

Etter flere år med reisevirksomhet verden rundt blir det mange timer i fly. Grafen viser antall personlige flytimer fra 2011 – 2023

Gjennomsnitt av mine egne daglige målte skritt gjennom ukene 5 til 8 i 2024

Tegningen viser resultater for nasjonale prøver i engelsk, lesing og regning på 5. trinn i skoleåret 2023/2024 i Arendal. Data publiseres av Udir og viser poeng i engelsk,…

The image shows how many games I played in 2023, as well as how many achievements I earned. It also shows the percentage of games I played with…

In this infographic, I share my top 5 Spanish series that I have watched throughout my life.