This is one of the playful resources created by the Data Literacy for Citizenship DALI project, co-funded by the Erasmus Plus prorgamme of the European Union.
We invite you to reflect on how your own reality might be represented through data. Find some data relevant to you and visually represent aspects of your life or the world you inhabit.
This project has been funded with support from the European Commission. This website reflects the views only of the authors, and the Commission cannot be held responsible for any use which may be made of the information contained therein.
Unauthorized use and/or duplication of this material without express and written permission from this site’s author and/or owner is strictly prohibited. Excerpts and links may be used, provided that full and clear credit is given to dalicitizens.eu with appropriate and specific direction to the original content.
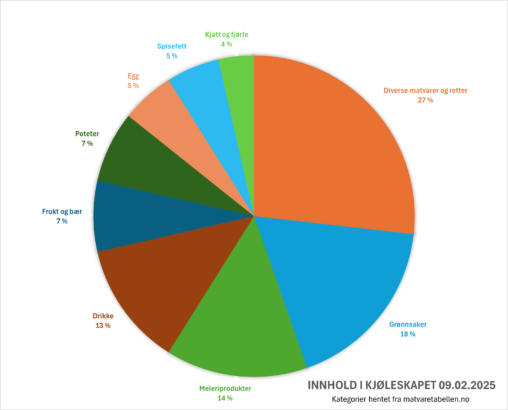
Categories are from matvaretabellen.no as public domain. All other data is my own. The diagram contains data of my refrigerator content on February 2nd, 2025. The data in…
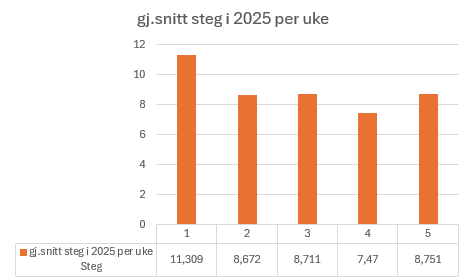
A chart showing the average amount of steps I’ve taken each week in 2025. The y-axis shows steps while the x-axis shows the weeks. Below you will find…
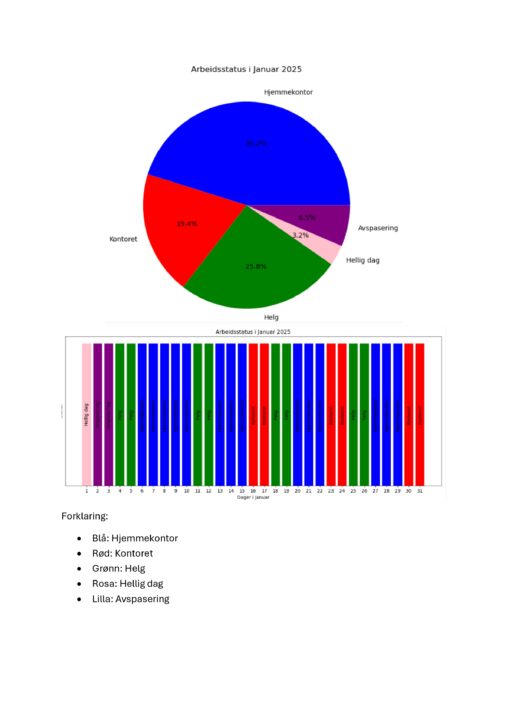
Søylediagrammet viser arbeidsstatus og arbeidsplass for hver dag i januar 2025: -Blå søyler representerer dager med hjemmekontor (mandag til onsdag, samt 9. og 10. januar). -Rød søyler representerer…