
20 Data visualizations Tagged "Music"
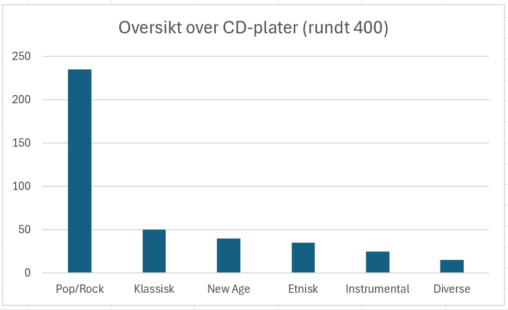
Oversikten viser antall CD-plater per sjanger. Dette er originale CD-plater som var kjøpt i løpet av flere år.
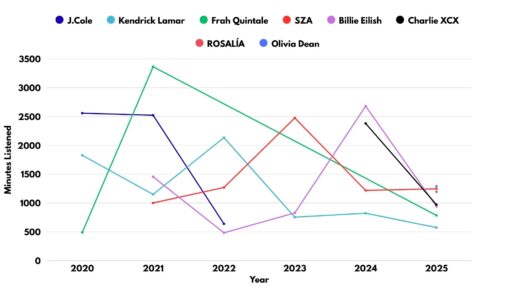
Data from Apple Music’s Replay service allowed me to graph the minutes listed to my favorite artists over the past 5 years.
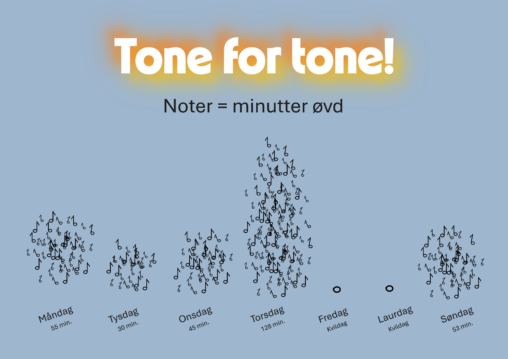
Dette er ein visualisering av minutter øvd på instrument i løpet av ei veke. Kvar note representerer eit minutt øvingstid. Illustrasjonen er delt er med Creative Commons lisens,…
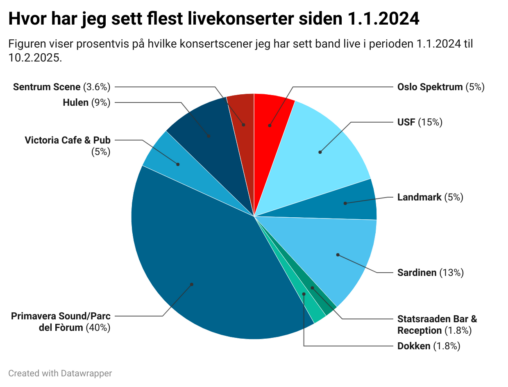
The figure shows in percent at which venues I’ve seen most bands live between 1.1.2024 til 10.2.2025. The data is from private notes and visualization is created with…
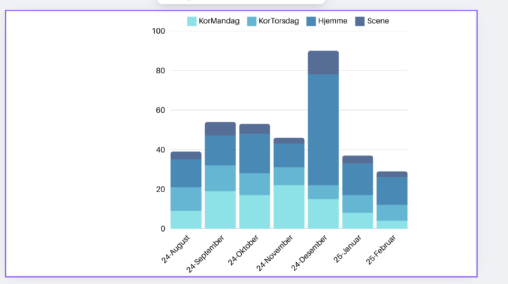
Oversikt over antall låter sunget gjennom øvelser og opptredener fra August 2024 til d.d februar 2025.
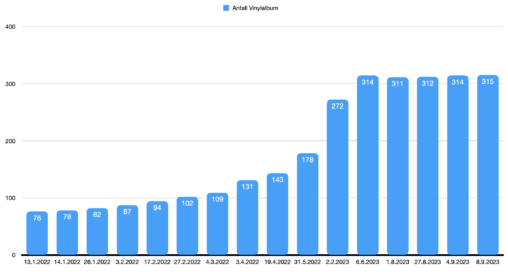
Søylediagram som viser hvor mange album vinylsamlingen min økte med fra Januar 2022 til September 2023 i tilfeldige intervaller.

This chart shows all artists on my Top Songs 2023 playlist on Spotify. It also shows the number of tracks each artists have on the playlist. The data…

The graph shows a comparison of the playlists with the music I liked best in the years 2019-2022. As expected, the year 2020 was characterized by more acoustic…

. A simple visualization of the last ten years of my music listening history. Made with and Adobe Photoshop.

Mine mest lyttede til sjangre på Spotify siste 6 måneder. Norsk pop er på topp, fulgt at norsk jazz, art pop, pop, Norwegian pop rap, Ecm-style jazz.

Picture represents my year in music in 2023, percentages are in comparison to last year.

Here is my music listening history for a day, sorted into the songs name, the artist, the song duration and what genre it fits into.


Data from my most recent playlists on Spotify displayed as a pie chart showing % of time spent on each (very individually assigned by me!) genre. CC 4.0

Information on the 100 songs I listened most to in 2022, including release year, gender of the artists, genre and country of origin. The data was collected from…

At the end of each year, the Spotify music application compiles, in a ranking, the list of your most listened to artists during that year. It also includes,…

According to my mobile data, this is the average time that I listen music during a month, actually during January.

This is a data visualization of my music listening habits this week (19.08.22 – 25.08.22). The owner of the data I am visualizing is .

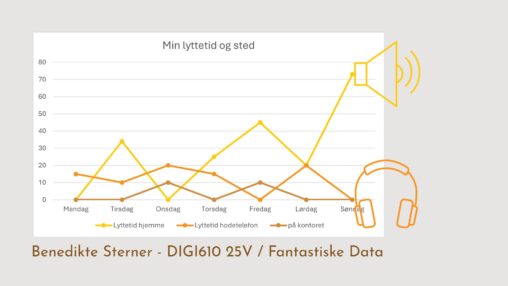
This is a graphic that shows the time I spend listening to music during a week and the type of music I listen to. The genres of music…