

1 Data visualizations Tagged "logistics"
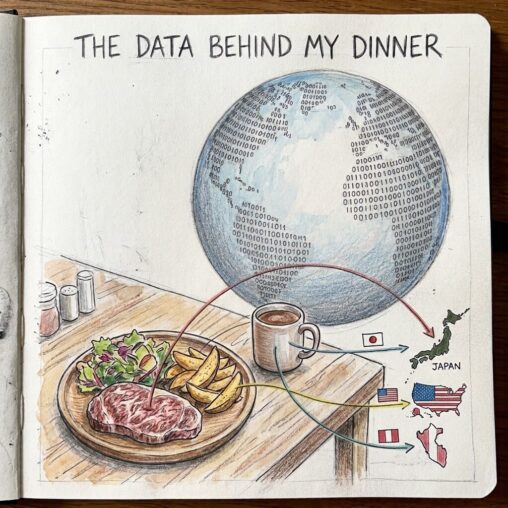
A notebook sketch drawn with colored pencils showing a dinner plate with wagyu beef, fries, and salad, alongside a mug of cocoa. Lines connect each item to country outlines and flags (Japan for the beef, the USA for the fries, and Peru for the cocoa), set against a background digital globe made of binary code (0 and 1) with the title \

The Data Behind My Dinner

This visual work, titled “The Data Behind My Dinner”, represents the invisible global supply chain and logistical data footprint associated with a single everyday meal. The visualization contrasts…