
6 Data visualizations Tagged "Life"
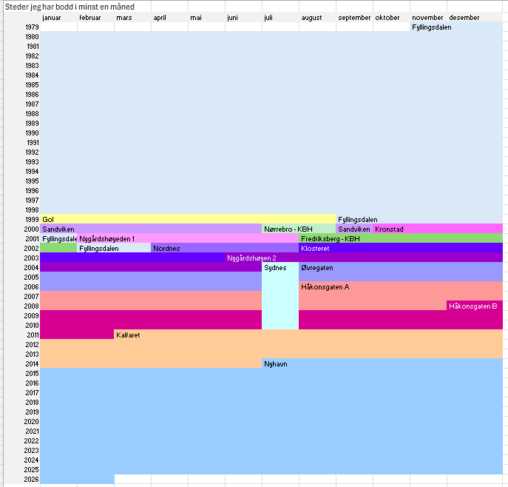
I have created I timeline for places I have lived for at least a month. I have colour coded the different abruptions, and also tried to use a…

Illustrations of 362 ferries. Number of ferries that I take in a year do to job. The Illustration are made by me, anyone can use it.

There are three charts, the first one represents the gender distribution of my friends, the second displays the age range my friends are and the last one represents…

The picture is a screenshot from Notion. There are no units, just check marks representing whether the task got done or not.

