
10 Data visualizations Tagged "knitting"
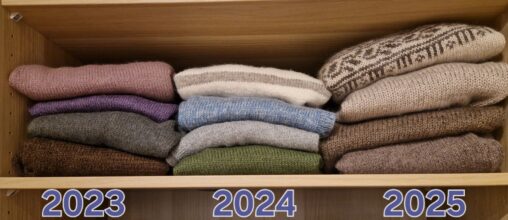
The picture shows my knitting production over the last three years – mainly sweaters for myself.
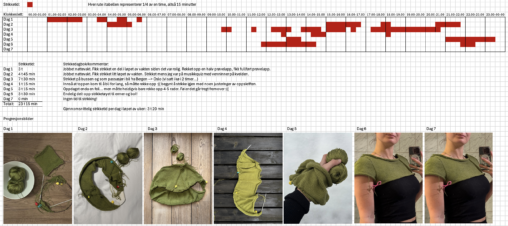
Visualiseringen viser hvilke tidspunkt på døgnet jeg har strikket, og hvor mange timer jeg har strikket i løpet av en dag og totalt i løpet av en uke….

Strikketøy (genser, votter, ragger og skjerf) jeg har startet på i 2025, uten å fullføre før årsslutt.
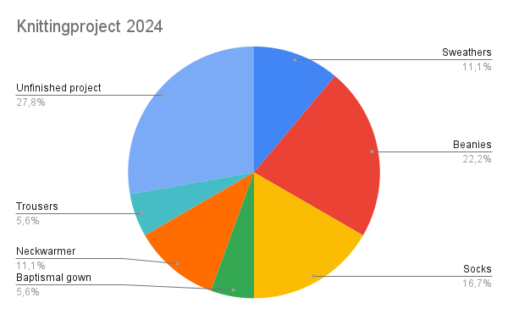
Overview of what my knitting projects resulted in for 2024. Creative Commons licence My data
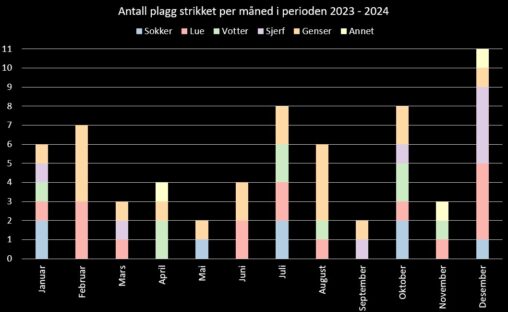
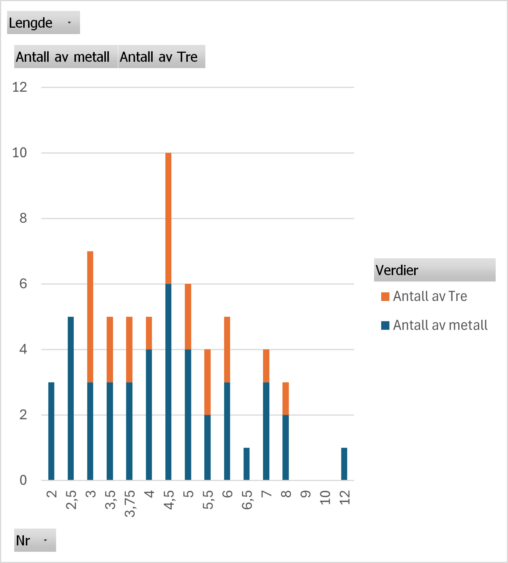
A stacked column graph that shows the amount of garments I have knit per month in the period 2023 – 2024. The values in the graph column are…

The figure shows time (in minutes) spent on knitting every day in a week (monday-sunday)
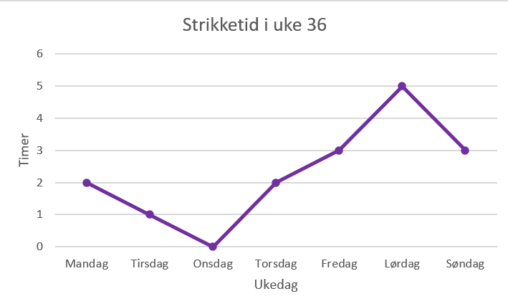
Dette linje-diagrammet viser strikketiden jeg hadde de ulike ukedagene i uke 36.

This is a representation over my finished knitting project each month from September 2020 until September 2023.
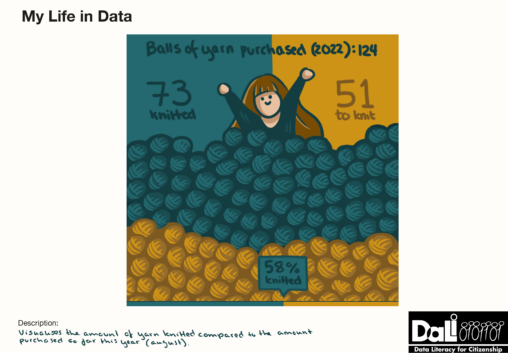
Gives an overview of yarn purchase and usage. 124 balls of yarn has been purchased so far this year (august), and 73 of these has been knitted. This…