
2 Data visualizations Tagged "heart rate"
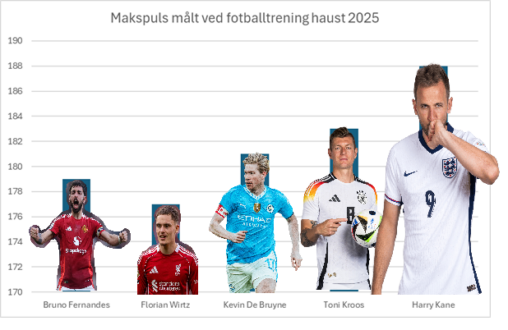
Max heart rate recorded by my Garmin training watch during football practice in autumn of 2025. Used Excel bar chart and it is heart rate in the y-axis,…
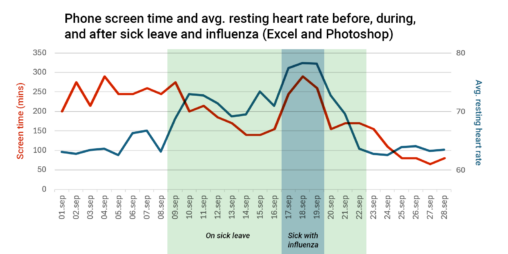
In September 2025, I was on a 14 day sick leave, during which I also fell ill with the flu for three days. When I looked at my…