
2 Data visualizations Tagged "habit tracker"
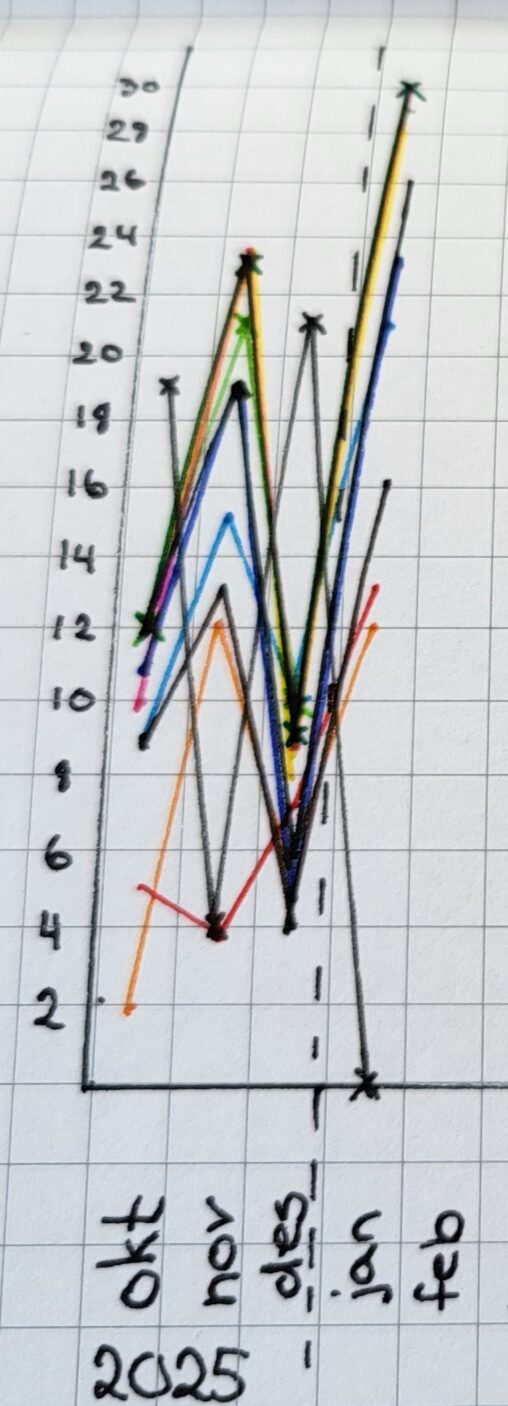
Each color represents one good intention. The graphs visualizes how many days per month I have been successful in completing the different intentions. This data is Public Domain….
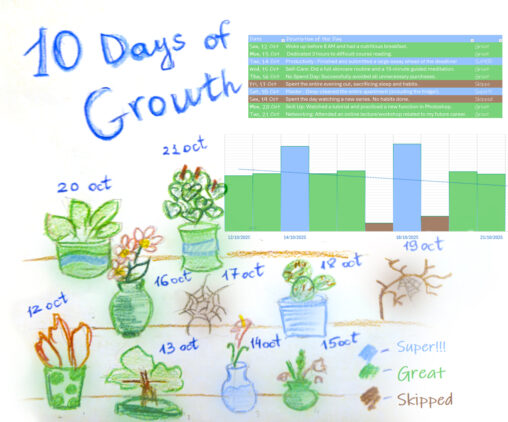
This is my personal habit tracker for 10 days – from October 12 to October 21, 2025. I visualized my progress through the metaphor of growing plants because…