
2 Data visualizations Tagged "#graphvisualization"
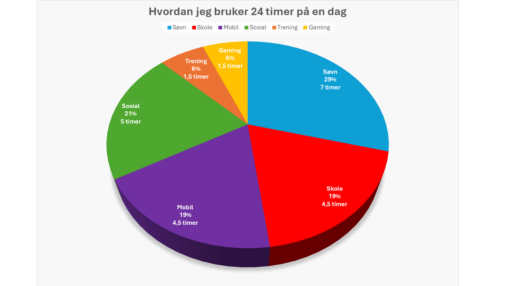
Visualiseringen viser at ila 24 timer, sover jeg mest (skulle gjerne vært 1 time lengre også, menmen), og er ganske sosial. Det verste jeg har på døgnet, er…

Number of trips taken to the store per day over the course of a week (W33, 2022).