
11 Data visualizations Tagged "#Food"
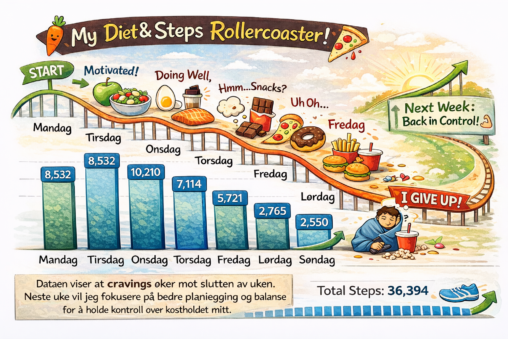
I starten av uken var jeg veldig motivert. Jeg spiste sunn mat, prøvde å gå på tur og nådde målet mitt på 7500 steps. Men det var ikke…
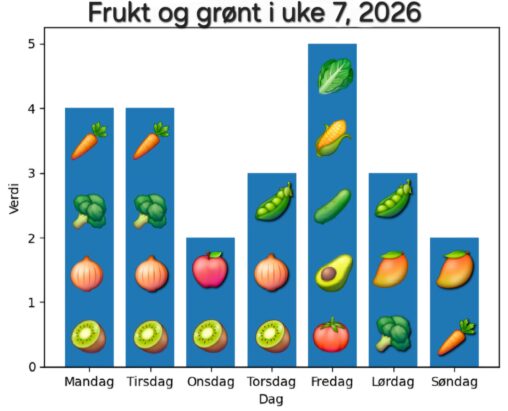
My attempt to eat the recommended 5 fruit and vegetables a day in week 7 of 2026 – Monday 4, Tuesday 4, Wednesday 2, Thursday 3, Friday 5,…
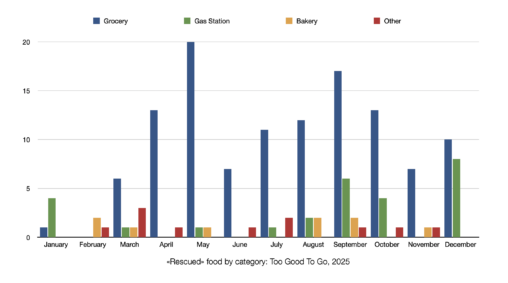
This graph shows the month-by-month journey of food saving in 2025. You can see how much food was ‘rescued’ through the Too Good To Go app, split into…
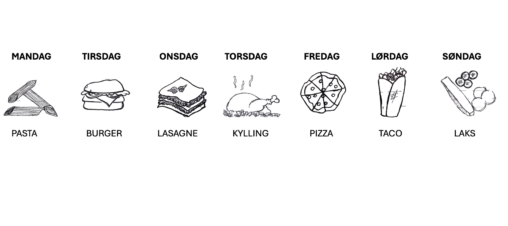
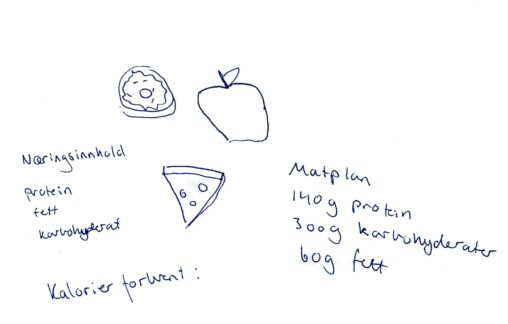
En tabell som går fra mandag til søndag med illustrasjoner og beskrivelser av matretter for hele uken.
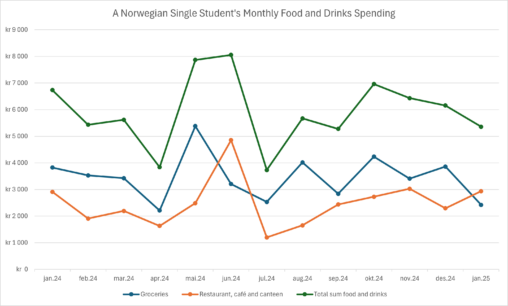
The visualisation is showing the monthly food and drinks spending from January 2024 to January 2025 in Norwegian kroner. Food and drinks are split into two categories: groceries…
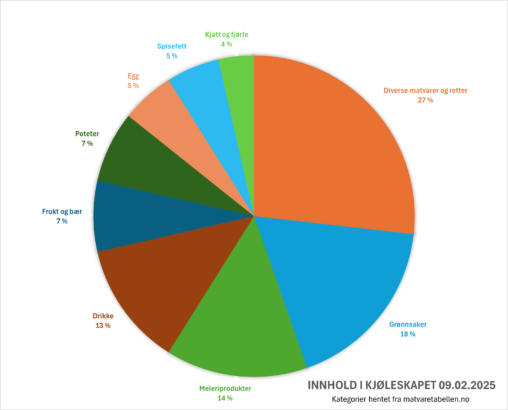
Categories are from matvaretabellen.no as public domain. All other data is my own. The diagram contains data of my refrigerator content on February 2nd, 2025. The data in…
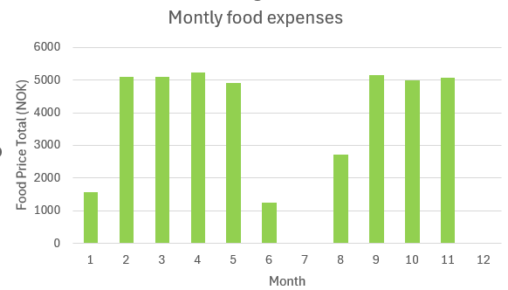
The expenses for food in Norway, Bergen for 2024, for 2 people. Prices are in NOK. July and December are 0 NOK, since I am home from University….

This graph shows the amount of coffee units collected by me during a month (January 5th to February 4th). I had a coffee subscription at the time and…

In this presentation, I want to share with my classmates and team the different things that I do in my life and the time I spend on those…