1 Data visualizations Tagged "follow-up"

Two side-by-side bar charts showing Vitamin B12 and Ferritin over three test dates. Vitamin B12 (pmol/L) increases from 152 on 04.10.24 (below the 250 lower reference limit) to 596 on 02.01.25 and 306 on 12.08.25 (within range). Ferritin (µg/L) decreases from 428 on 04.10.24 (above the 300 upper reference limit) to 194 on 02.01.25 and 285 on 12.08.25 (within range).

Metabolic Profile: Correction of Vitamin B12 Deficiency (Oct 2024–Aug 2025)

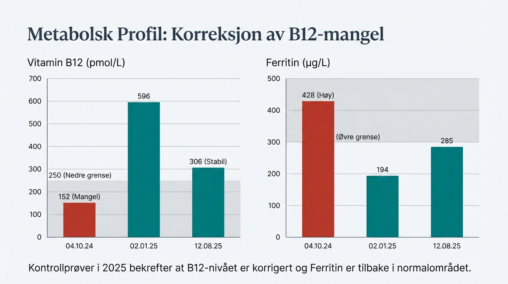
This visualization summarizes changes in two biomarkers across three laboratory timepoints (04.10.24, 02.01.25, 12.08.25). The left chart tracks Vitamin B12 (pmol/L), with a shaded band indicating the lower…