This is one of the playful resources created by the Data Literacy for Citizenship DALI project, co-funded by the Erasmus Plus prorgamme of the European Union.
We invite you to reflect on how your own reality might be represented through data. Find some data relevant to you and visually represent aspects of your life or the world you inhabit.
This project has been funded with support from the European Commission. This website reflects the views only of the authors, and the Commission cannot be held responsible for any use which may be made of the information contained therein.
Unauthorized use and/or duplication of this material without express and written permission from this site’s author and/or owner is strictly prohibited. Excerpts and links may be used, provided that full and clear credit is given to dalicitizens.eu with appropriate and specific direction to the original content.
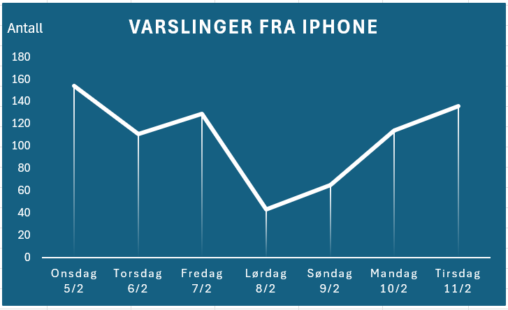
Denne visualiseringen representerer varsler som genereres på min iPhone. Dataene viser antall varsler jeg mottar daglig over en tidsperiode på en uke i februar 2025. X-aksen viser antall…
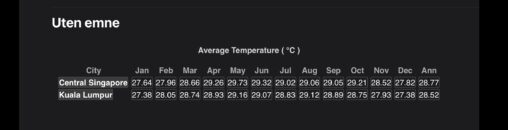
Oversikt over beløp brukt på café i perioden 2-26. februar 2024. Indikator plassert på 58 kr. brukt ettersom en caffe mocca koster 58,-. Om bildet i tabellen: “Coffee…