4 Data visualizations Tagged "DIGI610"
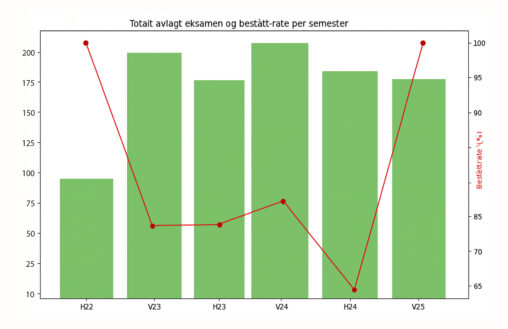
Visualisering av hvor mange som fullførte emnet ‘DIGI110 Fantastiske data’ ved Universitetet i Bergen fra og med høsten 2022 til og med våren 2025, og hvor stor andel…
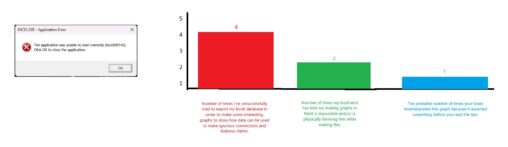
You can visualize anything in a graph, and that’s why you should always be critical to its content and what it’s actually showing.