
104 Data visualizations Tagged "#Bergen" (page 5 of 6)

The data show how much time per day I spent working out in the morning when I wake up waiting for the coffee. Minutes and days are my…
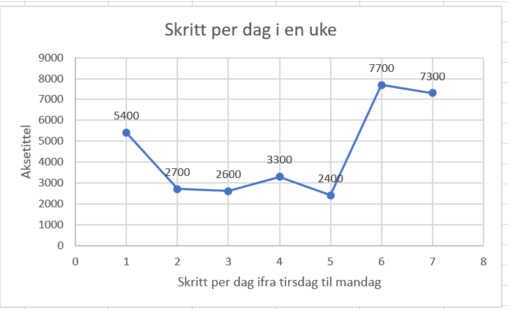

Two weeks of my daily steps are compared to the amount of rainfall per day measured in my city. The number of steps are displayed as points interconnected…
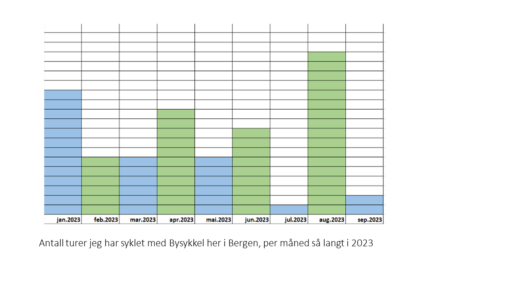
Jeg har laget et enkelt stolpediagram som viser antall sykkelturer jeg har foretatt med Bysykkel i Bergen per måned frem til nå i 2023
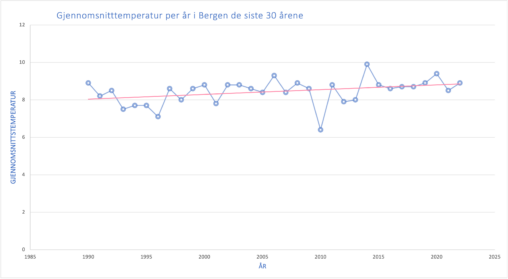
Gjennomsnittstemperatur per år i Bergen de siste 30 årene, i tidsperiode fra 1990-2023. Linjediagrammet viser gjennomsnittstemperaturen per år. Rød linje viser trenden til gjennomsnittstemperaturen.
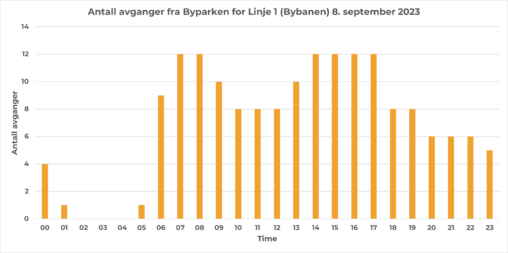
Antall avganger fra Byparken for Linje 1 (Bybanen) den 8. september 2023 presentert som et søylediagram. Søylenes høyde blir avgjort av antallet avganger med minuttall XX:00 – XX:59…
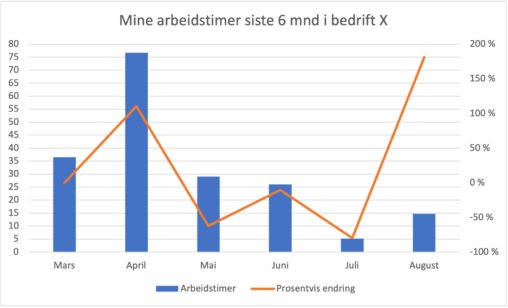
Oversikten viser hvordan mine arbeidstimer er fordelt de siste 6 månedene hos min arbeidsgiver bedrift X. Det er også lagt inn en graf som viser om månedens timeantall…

A coarse-grained pie chart depicting a typical day of the week for an anonymous student.
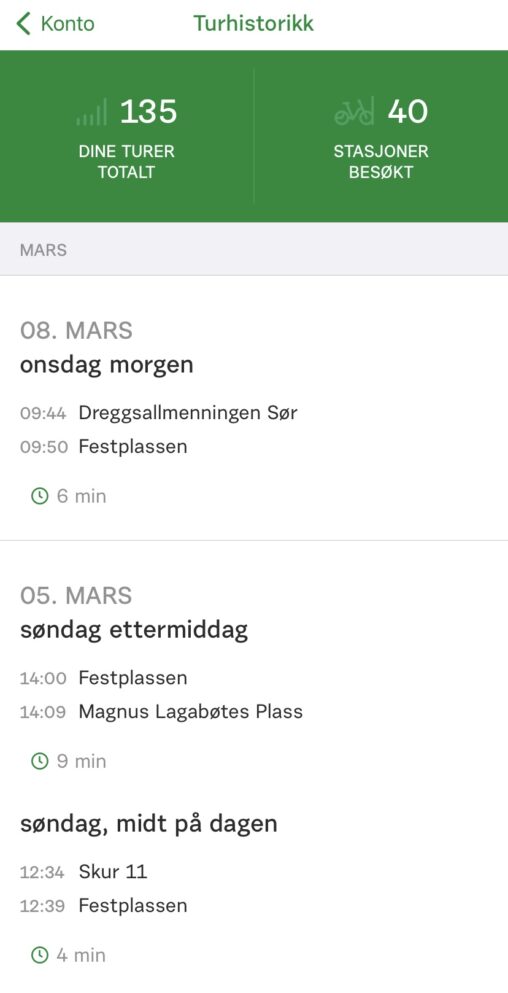
Oversikt over antall turer, antall besøkte stasjoner og siste turer med Bergen Bysykkel mellom august 2020 og mars 2023.
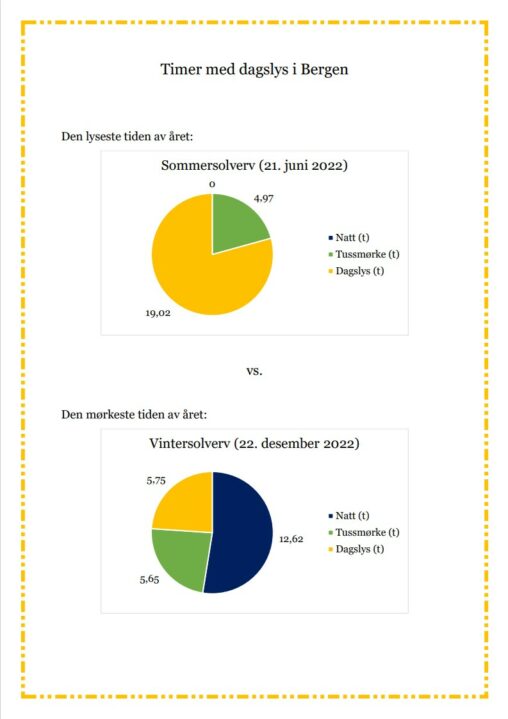
This data visualizes the difference between daylight in winter and daylight in summer in Bergen, Norway. The data is taken from timeanddate.no.

Verdiene viser antall døgn det har regnet, ifølge målestasjonene Yr.no bruker i de forskjellige byene. Opphavsrett © NRK og Meteorologisk institutt 2007–2023

The work is based on Yr.no’s weather history in Bergen and Kristiansand. This was recorded from the 8th of February until the 9th of march and in this…
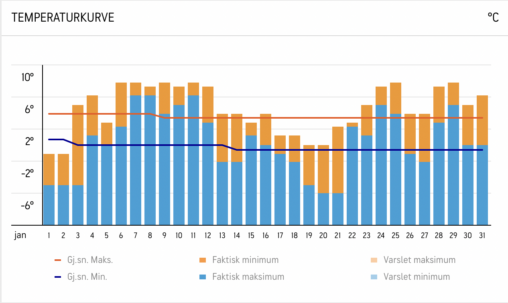
Grafen viser en oversikt over hvordan temperaturen i Bergen har variert i januar måned. © 2023 AccuWeather, Inc. “AccuWeather” og sun design er registrerte varemerker som tilhører AccuWeather,…
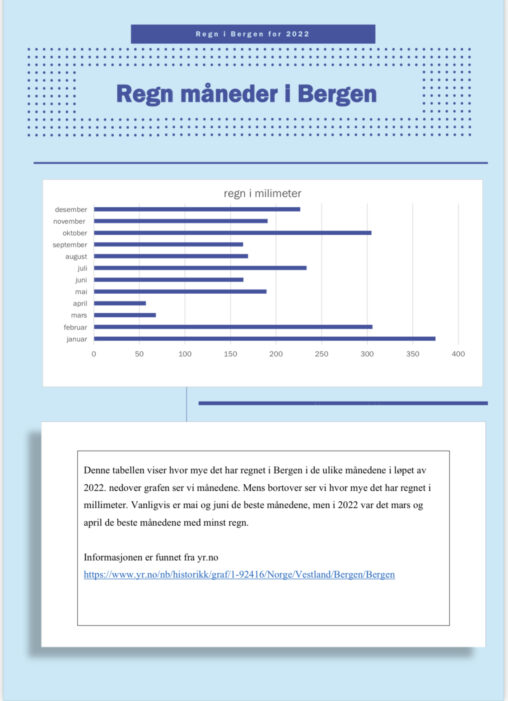
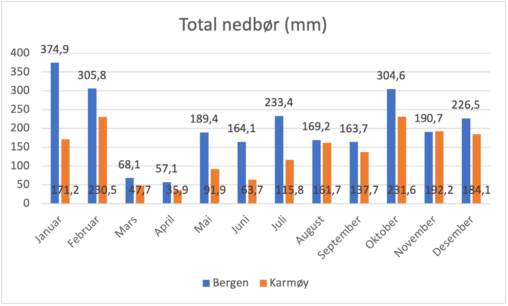
Denne tabellen viser hvor mye det har regnet i Bergen i de ulike månedene i løpet av 2022. nedover grafen ser vi månedene. Mens bortover ser vi hvor…
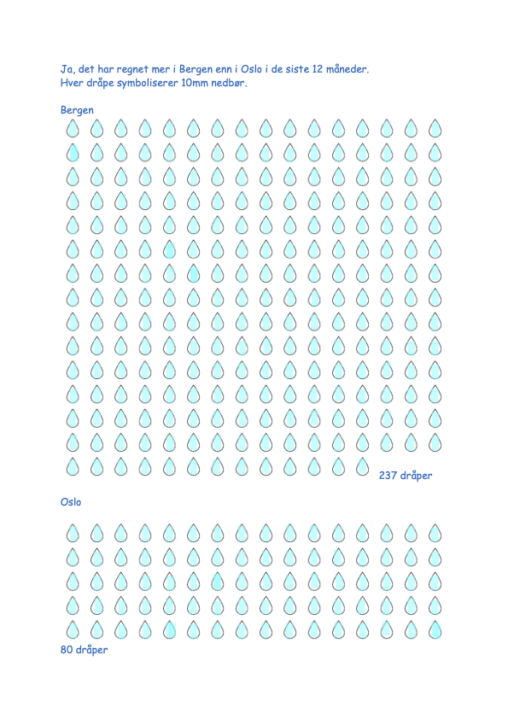
Bildet viser hvor mye det regnet i to byer i Norge i de siste 12 måneder. hver dråpe indikerer 10mm nedbør. På denne måten ser man tydelig hvor…
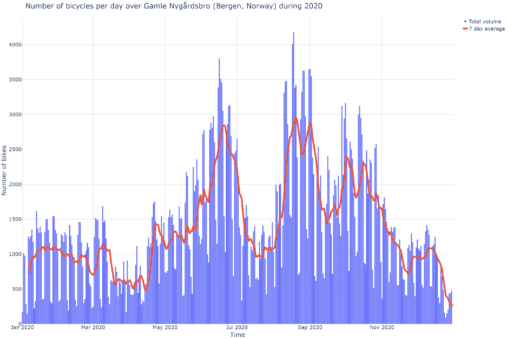
The visualisation is a graph showing the daily number of bicycle crossings in 2020 (early Covid-19) over a measuring point set up by The Norwegian Public Roads Administration…

X- axis = Months in the year Y-axis = Average temperature (Celsius)