1 Data visualizations Tagged "#Bergen #Norway#uib"
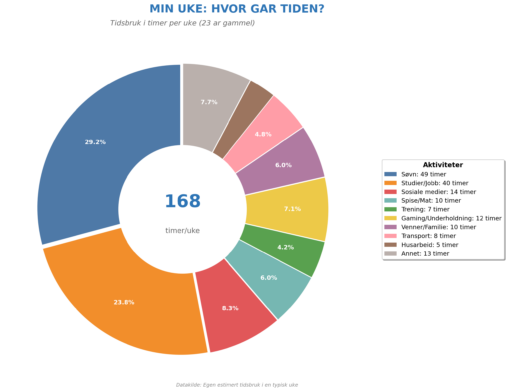
This donut chart visualizes my estimated weekly time distribution as a 23-year-old. The data represents how I spend my 168 hours each week across 10 categories: Sleep (49…

A SPLOT on the Web: DALI worlds.
Blame @cogdog for the TRU Collector Theme, based on Fukasawa by Anders Norén.
This donut chart visualizes my estimated weekly time distribution as a 23-year-old. The data represents how I spend my 168 hours each week across 10 categories: Sleep (49…