
27 Data visualizations Tagged "#Bergen #Norway" (page 1 of 2)
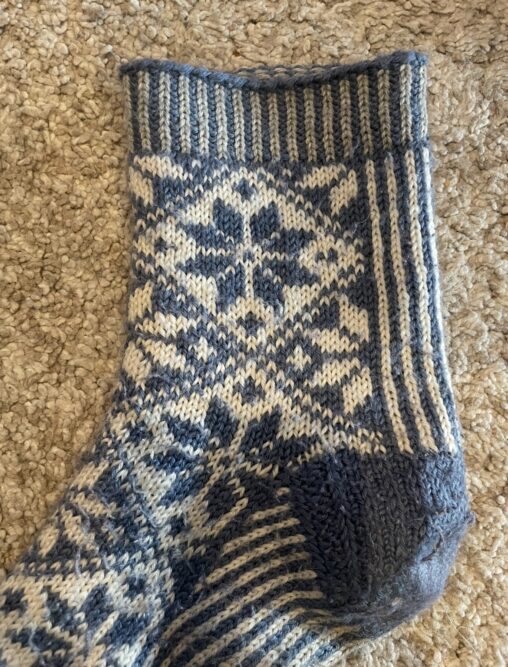
Dette er et bilde av strikkemønster på en strikket sokk. Hver maske er et datapunkt. Visualiseringen skal hjelpe til med å planlegge fasong, symmetri og forklare mønsteret visuelt…
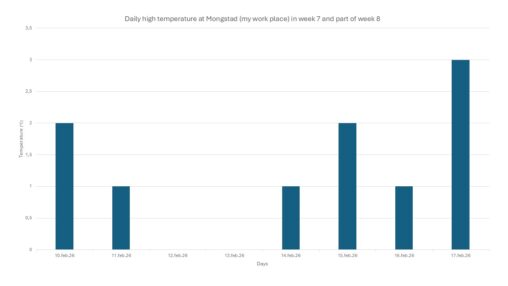
What is visualized is the observed maximum daily temperature (in degree celsius) at Mongstad where I work. The readings were taken from screen displaying temperatures at TCM. The…
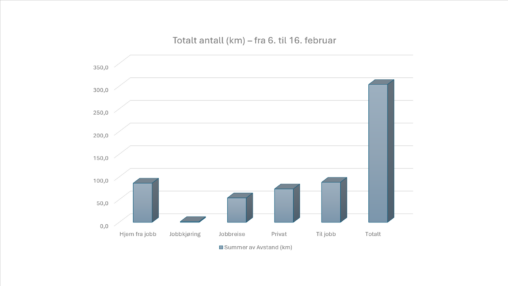
Digram over antall kilometer i løpet av 10 dager fordelt på ulike kategorier.

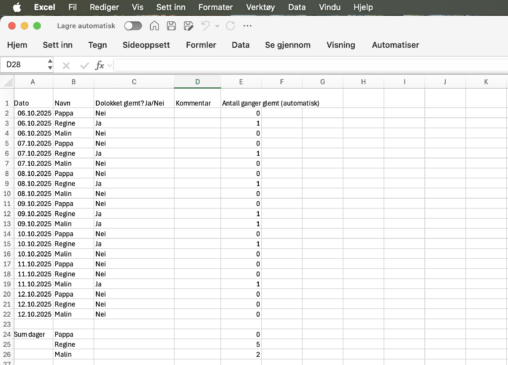
Hvor mange ganger jeg droppet frokost i uke 4 i 2026
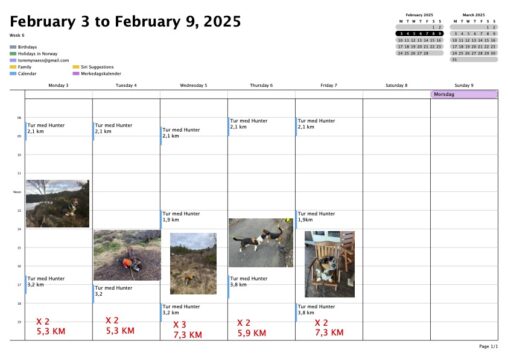
A weekly calendar where I have put down my walks with my dog. Here you find the time of day, the length of the walks, and how many…
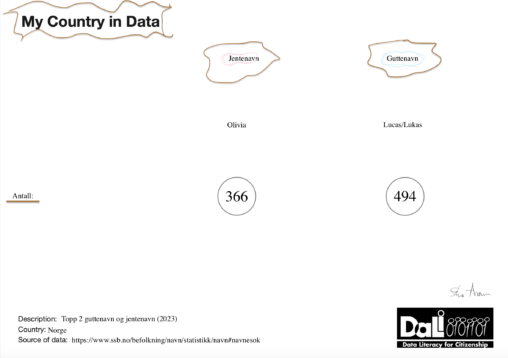
Kjært barn har mange navn! Navnetrender endrer seg fra tiår til tiår, men noen navn holder seg stabilt populære. I 2023 tronet Lucas/Lukas og Olivia øverst på listen…
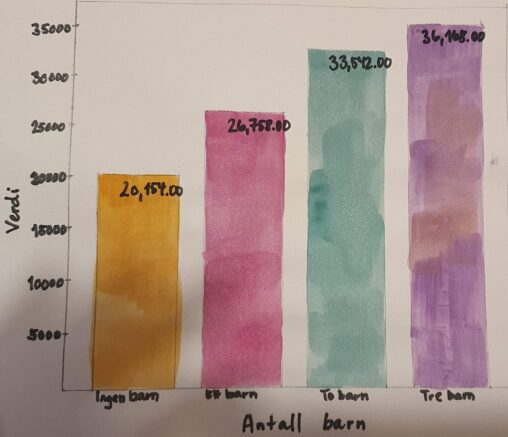
2024-tall fra SIFOs kalkulator for forbruksutgifter (referansebudsjett). Spesifisert at familien ikke har bil, og at det minste barnet går i barnehage. Malt med ett av mange malerskrin kjøpt…
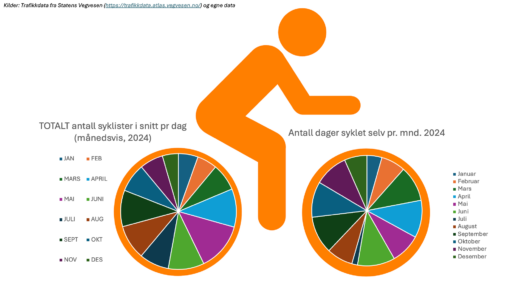
Statistikk som viser totalt antall syklister på “mitt målepunkt” i snitt pr dag (månedsvis, 2024) vs antall dager jeg syklet selv hver måned. Kilder: Trafikkdata fra Statens Vegvesen…
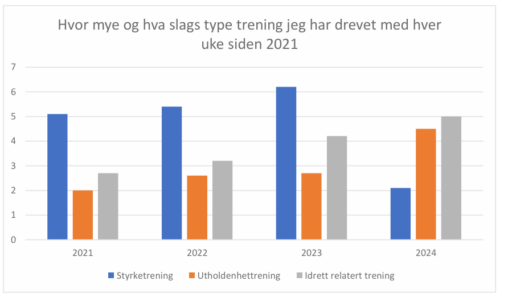
Oversikt over hvor mange timer, i gjennomsnitt, jeg brukte på de ulike treningskategoriene siden 2021. Kategoriene ble delt inn i utholdenhet, styrke og idrett relatert trening, ettersom de…
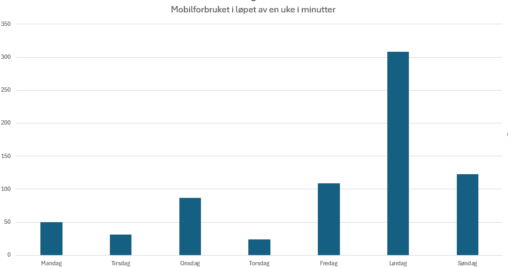
This bar chart illustrates mobile phone usage throughout a week in minutes. Each bar represents the total duration of mobile usage (in minutes) for each day of the…
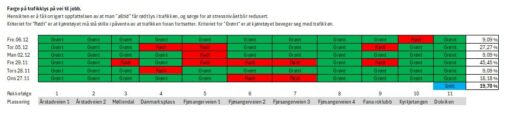
Farge på trafikklys på vei til jobb. Hensikten er å få korrigert oppfattelsen av at man “alltid” får rødt lys i trafikken, og sørge for at stressnivået blir…


The image shows a graph with sleep scores for 26 Feb – 3 Mar, as measured by a Garmin wrist watch. The score scale is 0-100 and the…

How I spend my time when the kids are home vs. how i spend my time when they are vacationing with their grandparents


Data ovenfor viser til antall gjennomsnittlige skritt jeg tok i året 2023. Det er hentet fra appen “Helse” som eies av meg og blir delt med Apple Inc.