
104 Data visualizations Tagged "#Bergen" (page 1 of 6)

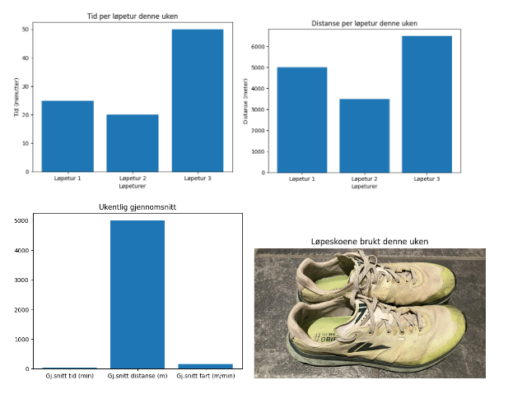
I denne datavisualiseringen, har jeg, ved hjelp av ChatGPT til å lage grafer for mine data, visualisert de tilgjengelige data for mine løpeturer denne uken. Dette inkluderer hvor…
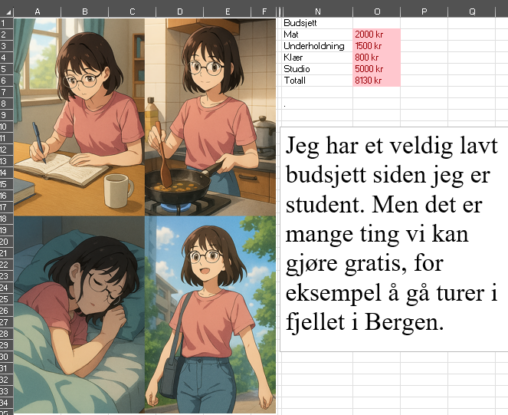
Den korte teksten er inspirert av studentlivet, både det økonomiske og hvordan vi kan være sosiale uten å bruke mye penger. “Jeg har et veldig lavt budsjett siden…
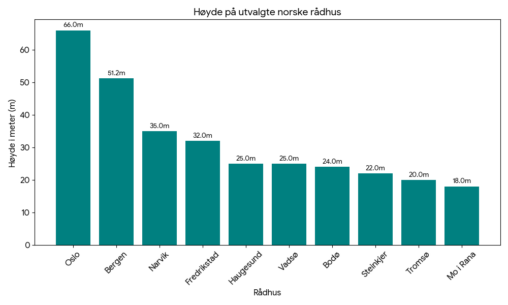
En oversikt over et utvalg norske rådhus, rangert etter høyde. Creative commons license.
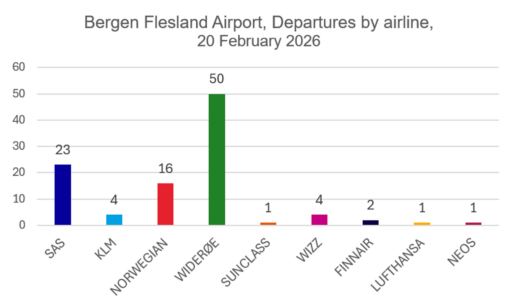
This is a visual representation of the 102 flight departures, sorted by airline, on Friday 20 February 2026 at Bergen Flesland Airport (BGO). Public domain, Avinor.
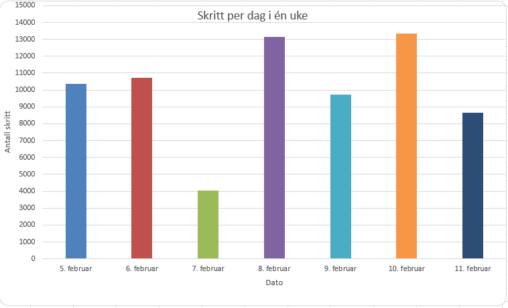
Denne visualiseringen viser en oversikt over antall skritt mål fra torsdag 5.februar til onsdag 11.februar. Dataen er hentet fra min Garmin smartklokke. Grafen viser nøyaktig antall skritt som…
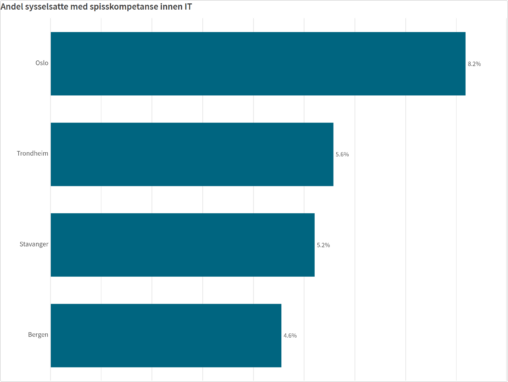
Spisskompetanse innen IT er viktig for at vi på vestlandet skal lykkes med å finne nye bein å stå på, i en region som i dag er avhengig…
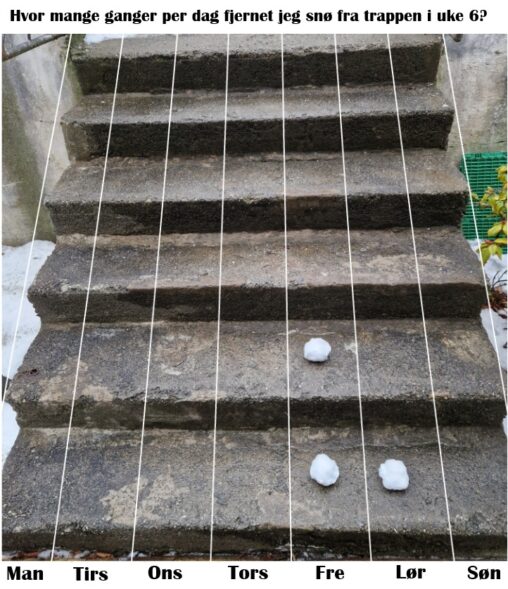
Hvor mange ganger fjernet jeg snø fra trappen i uke 6? Owner of the data is myself 🙂
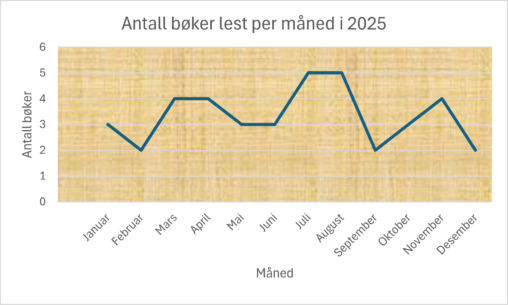
Eget produsert og visualisert data basert på hvor mange bøker jeg har lest i løpet av 2025, fordelt per måned. Målet var å vise utvikling over tid
Jeg har produsert og visualiserte hvor mange bøker jeg har lest i løpet av 2025, fordelt per måned. Målet var å vise utvikling over tid. Produsert av Isabel….
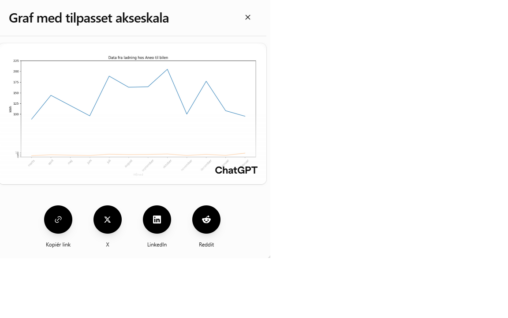
Jeg har samlet data fra min Aneo ladeopp og sat dem opp i excel. Disse data har jeg visualiseret via ChatGBT. https://chatgpt.com/s/t_698cb4d3d9908191a4b350dcf87d9476
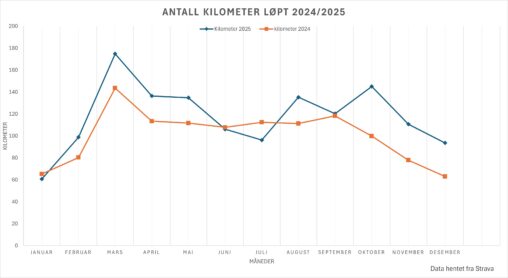
Denne grafen viser månedlig løpedistanse målt i kilometer for 2024 og 2025. Dataen er hentet fra registrerte løpeaktiviteter i Strava. For 2024 dekker tallene perioden fra 1. januar…
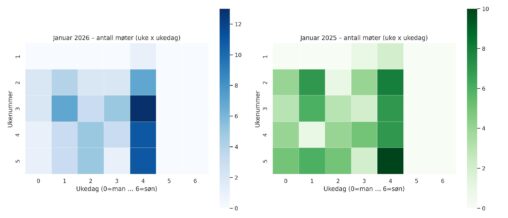
Antall møter per ukedag per uke i januar for både 2025 og 2026, basert på data fra business kalenderen. To varmekart side‑om‑side, der hver rad er ukenummer og…
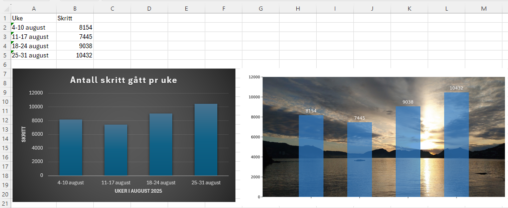
Søylediagram som viser antall skritt gått pr uke i august. 4-10 august 8154 skritt, 11-17 august 7445 skritt, 18-24 august 9038 skritt, 25-31 august 10432 skritt. Eier av…
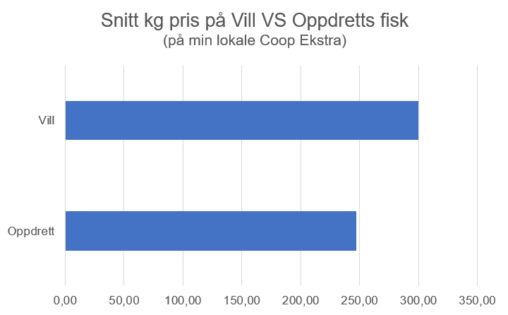
the data is a comparison of the average price of seafood products, either caught in the wild or farmed.
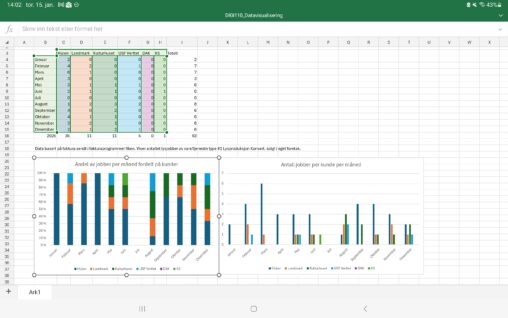
Data viser for hvilke kunder og antall ganger Ole har jobbet for en samlig av kunder gjennom sitt foretak som lystekniker i hele 2025. Data er hentet fra…
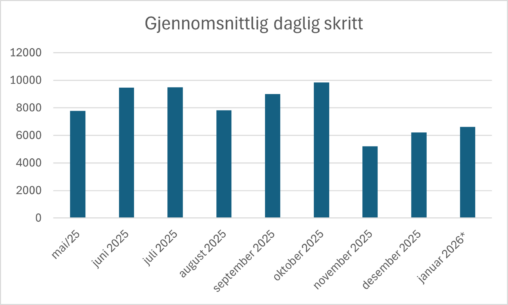
Stolediagram som visualisererer mitt gjennomsnittlige antall daglige skritt (gåing, løping, tur, osv.) per måned fra mai 2025 til januar 2026. Dataene eies av meg og er egeninnsamlet fra…
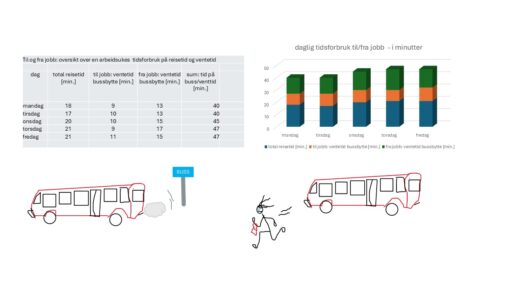
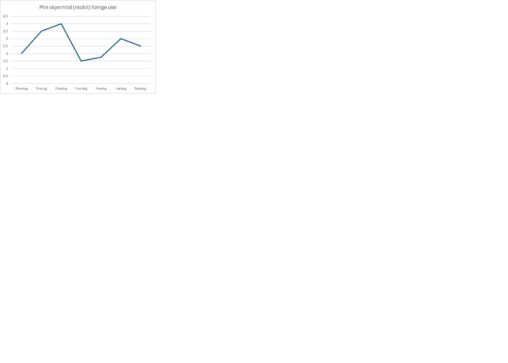
En ukes daglige tidsforbruk (i minutter) på bussreiser, inkludert ventetid ved bussbytte.