This is one of the playful resources created by the Data Literacy for Citizenship DALI project, co-funded by the Erasmus Plus prorgamme of the European Union.
We invite you to reflect on how your own reality might be represented through data. Find some data relevant to you and visually represent aspects of your life or the world you inhabit.
This project has been funded with support from the European Commission. This website reflects the views only of the authors, and the Commission cannot be held responsible for any use which may be made of the information contained therein.
Unauthorized use and/or duplication of this material without express and written permission from this site’s author and/or owner is strictly prohibited. Excerpts and links may be used, provided that full and clear credit is given to dalicitizens.eu with appropriate and specific direction to the original content.
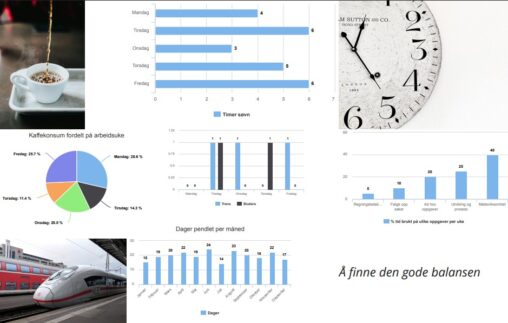
Bilde på ulik statistikk som kan føres for å få bedre oversikt over sammenhengen mellom ulike aktiviteter i hverdagen. Fiktiv statistikk, men måleenheter som ville ha vært naturlige:…
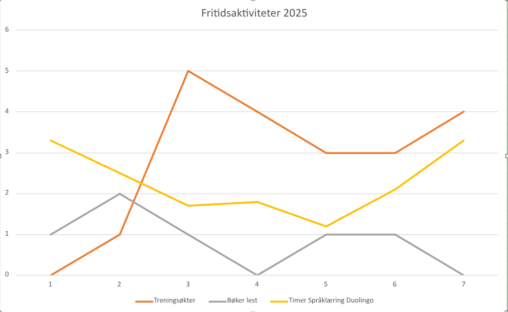
Bildet viser hvor mange treninger jeg har vært på, hvor mange bøker jeg har lest og antall timer brukt til språklæring på Duolingo i årets 7 første uker.