4 Data visualizations Tagged "activity"
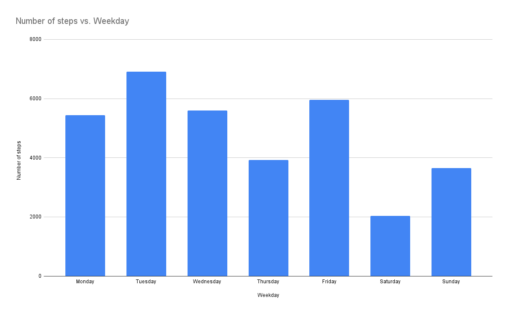
The bar chart visualises the number of steps I took that my digital watch recorded in week 8. The number of steps have been divided into weekdays to…
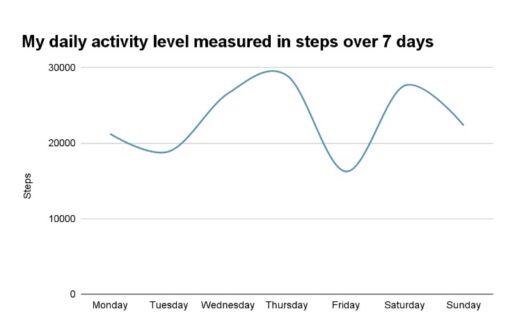
Using a smart watch I track several metrics like sleep duration and quality, activity measured in steps and heart rate. This image is my daily activity measured in…
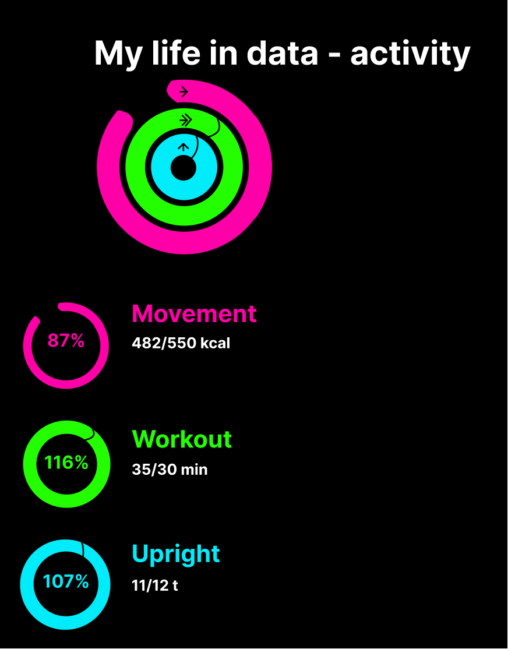
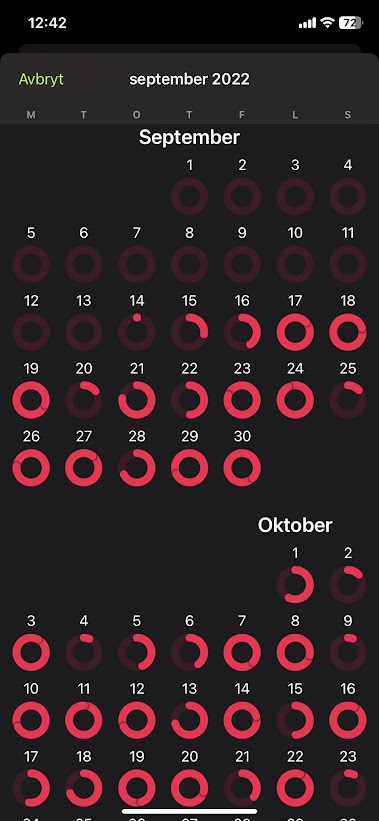
Apple Watch Activity Tracker er en teknologi som sporer din fysisk aktivitet døgnet rundt, fra antall skritt og kaloriforbruk til puls og treningsintensitet.